Rapid ICT Suite - MTF Concepts & iFVGTitle: Rapid ICT Suite - MTF Concepts & iFVG
Overview
Unlock a new level of market analysis with the Rapid ICT Suite, a comprehensive, all-in-one indicator designed for the discerning price action trader. This powerful tool merges two distinct analytical engines into one seamless experience, allowing you to overlay critical Higher Timeframe (HTF) market structure onto your current chart while simultaneously tracking real-time Fair Value Gaps (FVGs) and their inversions (iFVGs).
Whether you are a scalper needing to respect 1H structure, a day trader aligning with the 4H bias, or a swing trader mapping the daily trend, this indicator provides the clarity and context you need to make higher-probability trading decisions. It was built from the ground up to solve common issues traders face, delivering stable, precise, and flexible analysis.
The Strategy: Targeting IRL with iFVG Entries
The Destination (The "Why"): Internal Range Liquidity (IRL)
On a Higher Timeframe (HTF), we will identify major Internal Range Liquidity (IRL) zones. In the context of ICT, IRL simply refers to unmitigated Fair Value Gaps (FVGs) that exist within a broader trading range.
These HTF FVGs act as powerful magnets for price. The market will often seek out these zones to rebalance before continuing its next major move. By plotting these on our chart, we establish a clear directional bias and a high-probability target. Our indicator will now label these HTF FVG boxes as "IRL".
The Entry Signal (The "How"): Inverted Fair Value Gaps (iFVG)
Once we have our HTF IRL target, we drop down to our Lower Timeframe (LTF) for execution.
We wait for price to create an Inverted Fair Value Gap (iFVG). An iFVG is a regular FVG that has failed and been traded through, signifying a shift in momentum.
An iFVG appearing on the LTF provides a high-precision entry signal to take a trade in the direction of the HTF IRL zone. It's our confirmation that the market is likely now making its move towards that destination.
Key Features
Multi-Timeframe Order Blocks (Boxes): Automatically identify and plot key HTF demand and supply zones (Order Blocks) onto your chart.
Multi-Timeframe Fair Value Gaps (Boxes): See where HTF imbalances exist, giving you a clear map of institutional reference points and potential targets.
Multi-Timeframe Liquidity Pools (Boxes): Pinpoint where buy-side and sell-side liquidity is likely resting, based on clusters of old highs and lows.
Current Timeframe FVG & iFVG (Lines/Labels): A second, independent engine tracks FVGs on your chosen timeframe, monitors them for mitigation, and automatically identifies when an FVG has been inverted (iFVG), a crucial shift in market dynamics.
The "Rapid" Advantage: Solving Trader Frustrations
This indicator was engineered to overcome three of the most common problems with technical indicators:
1. ✅ No More Flickering or "Ghost" Signals
The Problem: Many indicators show signals on the live, forming candle. This causes zones or signals to appear and disappear ("flicker"), leading to confusion and false entries.
The Solution: The Rapid ICT Suite uses 100% confirmed, closed-candle data for all its calculations (OB, FVG, and Liquidity). A zone will only appear on your chart after the price action that confirms it is complete. This means every signal is stable, reliable, and non-repainting.
2. ✅ Frame-Perfect, Precise Placement
The Problem: Indicators that use lookback logic often draw their signals one candle too late, causing a visual disconnect between the price pattern and the signal itself.
The Solution: We have corrected this common flaw. Every box and line is drawn starting from the exact confirmation candle of the pattern. This frame-perfect precision is critical for accurate analysis and planning your entries.
3. ✅ The Dual Analysis Engine: Uncluttered & Flexible
The Problem: Trying to analyze multiple timeframes at once can lead to cluttered charts and mental overload .
The Solution: This suite contains two independent parts that you can control separately.
Part 1 gives you the macro context—the HTF structure where big moves originate.
Part 2 gives you the micro details—the real-time FVG and iFVG story on your trading timeframe.
Use them together for a complete picture, or toggle one off to focus on a specific aspect of your strategy. This flexibility keeps your workspace clean and your analysis sharp.
How to Use & Settings Explained
The indicator settings are neatly organized into two main parts.
Part 1: MTF Concepts (OB, FVG, Liq)
This section controls the Higher Timeframe boxes that are overlaid onto your current chart.
Higher-TF for OB/FVG/Liq: This is the most important setting. Select the higher timeframe you want to analyze. For example, if you are trading on the 15-minute chart, you might set this to 240 (4-Hour) to see the key 4H zones.
Show Order-Blocks / FVGs / Liquidity: Simple toggles to turn each type of HTF zone on or off.
Max... Count: Controls how many of the most recent zones are displayed on the chart, preventing clutter from old, irrelevant zones.
Part 2: FVG & iFVG (Lines/Labels)
This section controls the second engine, which analyzes FVGs and iFVGs on its own selected timeframe.
Timeframe for FVG/iFVG: Choose the timeframe for this analysis. You can leave it blank to use your current chart's timeframe, or set it to a specific one.
Mitigation Type & Mitigation %: A powerful feature to define when an FVG is considered "used up."
Type: Choose if mitigation is counted from the candle's Wick or Close.
Percent: Set how far price must retrace into an FVG (e.g., 50%) before it is considered mitigated and the lines are removed from your chart.
FVG/iFVG Count: Controls how many of the most recent FVG/iFVG zones are displayed.
Style & Color Settings: Fully customize the appearance of the lines and labels to match your chart theme.
Final Words
This indicator was built to provide actionable clarity. By understanding the interplay between higher-timeframe structure and current price action, you can significantly enhance your trading edge. Thank you for choosing the Rapid ICT Suite.
Happy trading!
Search in scripts for "price action"

SHYY TFC SPX Sectors list This script provides a clean, configurable table displaying real-time data for the major SPX sectors, key indices, and market sentiment indicators such as VIX and the 10-year yield (US10Y).
It includes 16 columns with two rows:
* The top row shows the sector/asset symbol.
* The bottom row shows the most recent daily close price.
Each price cell is dynamically color-coded based on:
* Direction (green/red) during regular trading hours
* Separate colors during extended hours (pre-market or post-market)
* VIX values greater than 30 trigger a distinct background highlight
Users can fully control the position of the table on the chart via input settings. This flexibility allows traders to place the table in any screen corner or center without overlapping key price action.
The script is designed for:
* Monitoring broad market health at a glance
* Understanding sector performance in real-time
* Spotting risk-on/risk-off behavior (via SPY, QQQ, VIX, US10Y)
Unlike traditional watchlists, this table visually encodes directional movement and trading session context (regular vs. extended hours), making it highly actionable for intraday, swing, or macro-level analysis.
All data is pulled using `request.security()` on daily candles and uses pure Pine logic without external dependencies.
To use:
1. Add the indicator to your chart.
2. Adjust the table position via the input dropdown.
3. Read sector strength or weakness directly from the table.

LiquidEdge Original1️⃣ Why Most Traders Miss Key Market Turning Points
Most traders (you) struggle to identify true market pivots THE REAL TOP and BOTTOMS where reversals begin.
❌ You enter too early or too late because price alone doesn’t give enough confirmation
❌ You follow price blindly, unaware of the volume pressure building underneath
❌ You get caught in sideways markets, not realizing they’re often accumulation or distribution zones
❌ You can’t tell if momentum is building or fading, which leads to low confidence and inconsistent results
👉 LiquidEdge helps solve this by tracking volume momentum through a modified MFI slope and scoring system. It highlights potential pivots with real context, so you can see where smart money might be entering or exiting before price makes it obvious.
2️⃣ What LiquidEdge Actually Does and How
LiquidEdge helps solve common trading problems by adding structure and clarity to volume analysis.
✅ It builds on the classic Money Flow Index (MFI), but instead of just showing overbought/oversold levels, it calculates the slope of MFI to track real-time changes in volume momentum
✅ Each setup is scored based on a combination of factors: divergence strength, trend alignment using EMA, and whether the signal occurs inside a liquidity zone
✅ Hidden accumulation or distribution is revealed when volume pressure increases or fades while price remains flat or moves slightly, a sign of smart money positioning
✅ Divergences are only flagged when they occur near pivot zones and align with overall trend conditions, helping reduce false signals
✅ Potential pivots are identified when multiple factors overlap such as a liquidity zone breach, volume slope shift, and valid divergence which often signals entry or exit points for institutional players
👉 The result is a structured interpretation of price and volume flow, helping traders read momentum shifts and potential reversals more clearly in both trending and ranging markets.
3️⃣ What Makes LiquidEdge Different
LiquidEdge is built on top of the classic Money Flow Index (MFI), but adds structure that transforms it from a basic momentum tool into a decision-support system.
Instead of simply showing highs and lows, it scores each potential setup based on:
✅ The steepness and direction of the MFI slope (used to measure volume pressure)
✅ Whether the setup aligns with the broader trend using an EMA filter (default: 200 EMA)
✅ Whether the signal appears inside predefined liquidity zones (MFI above 80 or below 20)
👉 This scoring system reduces noise and helps you focus only on high-probability setups.
👉 It also checks volume pressure across multiple timeframes using MFI slope on 5M, 15M, 1H, 4H, and Daily charts. This reveals whether short-term moves are backed by longer-term volume momentum.
Color changes in the line and histogram are not decorative they reflect real shifts in volume pressure. Every visual cue is linked to live market logic.
What Makes It Stand Out
👉 Setup Scoring That Makes Sense
Each setup is scored by combining:
Signal strength (MFI slope intensity and stability)
Trend direction (via customizable EMA)
Liquidity zone relevance (MFI range filtering)
This structured scoring means you spend less time second-guessing and more time reading clean signals.
👉 Flow That Follows Real Momentum
The slope of the MFI tracks whether volume pressure is rising or falling:
🟢 Green = increasing inflow (buying pressure)
🔴 Red = increasing outflow (selling pressure)
👉 Multi-Timeframe Volume Context
LiquidEdge calculates flow direction independently on each major timeframe. You’ll know if short-term setups are confirmed by higher timeframe volume or going against it.
👉 Smart Divergence Filtering
Unlike simple divergence tools that compare price highs/lows directly, LiquidEdge filters divergences based on:
Local pivot zones (defined by lookback periods)
Trend confirmation (to eliminate countertrend noise)
4️⃣ How LiquidEdge Works (Under the Hood)
LiquidEdge tracks directional momentum using the slope of the Money Flow Index (MFI) giving you a real-time read on buying and selling pressure.
When the slope rises, it means buyers are stepping in and volume is supporting the move.
When it falls, sellers are taking control and volume outflow is increasing.
This slope acts like a pressure gauge for the market, helping you spot when a trend has strength or when it's starting to fade.
💡 Quick Comparison
RSI = momentum from price
MFI = momentum from price + volume
LiquidEdge takes it one step further by calculating the rate of change (slope) in MFI. That’s where the pressure signal comes from not just value, but directional flow.
Core Calculations (Simplified)
Typical Price = (High + Low + Close) ÷ 3
Raw Money Flow = Typical Price × Volume
MFI = 100 −
MFI ranges from 0 to 100.
High = strong buying volume
Low = growing selling pressure
LiquidEdge then calculates the slope of this MFI over time to track volume momentum dynamically.
Divergence Engine
LiquidEdge detects divergence by comparing price pivots with the direction of MFI slope.
❌ If price makes a higher high but MFI slope turns down, it’s a bearish divergence
✅ If price makes a lower low but MFI slope rises, it’s a bullish divergence
Divergences are only confirmed when they occur:
Near local pivot zones (defined by configurable lookback windows)
And, optionally, in alignment with the broader trend using an EMA filter
This filtering helps reduce false positives and keeps you focused on clean setups.
Structured Confidence Scoring
Each signal is visually scored based on:
➡️ Whether a valid divergence is detected
➡️ Whether the signal occurs inside a liquidity zone (MFI > 80 or < 20)
➡️ Whether the setup aligns with the overall trend direction (EMA filter)
More confluence = higher confidence
The scoring system helps prioritize setups that meet multiple criteria, not just one.
Liquidity Zones
Above 80: Signals possible buying exhaustion 👉 risk of reversal
Below 20: Indicates potential selling exhaustion 👉 watch for a bounce
Zones are shaded directly on the chart to highlight pressure extremes in real time.
Price + Volume Fusion
LiquidEdge blends price action with volume pressure using MFI slope and histogram behavior. It doesn’t just show you where price is moving. it shows whether the move is backed by real volume.
This lets you see:
Whether volume is confirming or fading behind a move
If a reversal is building even before price confirms it
Visual Feedback That Speaks Clearly
🟢 Green slope = increasing buying pressure
🔴 Red slope = increasing selling pressure
5️⃣ When Price Is Flat but LiquidEdge Moves: Volume Tells the Truth
One of the most useful things LiquidEdge can do is reveal pressure shifts when price looks neutral.
If price is moving sideways but the MFI slope or histogram rises, it may suggest that buying pressure is quietly increasing possibly pointing to early accumulation.
If price stays flat while the volume slope or histogram drops, this could indicate distribution, where sellers are exiting without moving the market noticeably.
These changes don’t guarantee a breakout or breakdown, but they often precede key moves especially when combined with other confluences like trend alignment or liquidity zones.
👉 LiquidEdge helps spot these setups by measuring volume momentum shifts beneath price action.
It doesn’t predict the future, but it gives you additional context to evaluate what may be developing before it’s visible on price alone.
6️⃣ Multi-Timeframe Flow Table
LiquidEdge includes a real-time table that tracks volume pressure across multiple timeframes including 5-minute, 15-minute, 1-hour, 4-hour, and daily charts.
Each row reflects the direction of the MFI slope on that timeframe, indicating whether volume pressure is increasing (inflow) or decreasing (outflow).
🟢 A rising slope suggests that buying momentum is building
🔴 A falling slope suggests selling pressure may be increasing
👉 This lets traders quickly assess whether short-term setups are aligned with higher timeframe volume trends a useful layer of confirmation for both intraday and swing strategies.
Rather than flipping between charts, the table gives you a snapshot of flow strength across the board, helping you stay focused on opportunities that align with broader market pressure.
7️⃣ Timeframes & Assets
Where LiquidEdge Works Best:
✅ Crypto: Supports major coins and high-volume altcoins (BTC, ETH, Top 100)
✅ Stocks: Effective on large-cap and mid-cap equities with consistent volume
✅ Futures: Tested on instruments like NQ, MNQ, ES, and MES
✅ Any liquid market where volume data is reliable and stable
For best results, use LiquidEdge on assets with consistent trading volume. It’s not recommended for ultra-low volume crypto pairs or micro-cap stocks, where irregular volume can distort signals.
Recommended Timeframes:
👉 Intraday trading: Works well on 3-minute, 5-minute, 15-minute, and 1-hour charts
👉 Swing trading: Performs reliably on 4-hour, daily, and weekly charts
👉 Ultra short-term (1-minute or less): Not recommended due to high noise and low reliability
LiquidEdge adapts to various trading styles from scalping short-term momentum shifts to analyzing broader volume trends across swing and positional setups. The key is choosing assets and timeframes with reliable volume flow for the tool to work effectively.
8️⃣ Common Mistakes to Avoid When Using LiquidEdge
❌ Using It in Isolation
LiquidEdge offers valuable context, but it’s not designed to function as a standalone trading system. Always combine it with key tools such as trendlines, support/resistance zones, chart structure, or fundamental data. The more supporting evidence you have, the stronger your analysis becomes.
❌ Relying on a Single Indicator
No indicator, including LiquidEdge, can account for every market condition. It’s important to use it alongside other forms of confirmation to avoid making decisions based on limited data.
❌ Misinterpreting Divergences as Reversals
A divergence between price and volume pressure doesn't always signal the end of a trend. If the broader direction remains strong (based on EMAs or higher timeframe volume flow), a divergence could reflect temporary consolidation rather than reversal.
❌ Ignoring Trend Alignment and Confidence Scoring
LiquidEdge includes confidence scoring to help validate signals. Disregarding this structure can lead to reacting to weak or out-of-context divergences, especially in choppy or low-volume environments.
❌ Using It on Second-Based or Tick Charts
Very low timeframes introduce too much noise, which can distort volume slope and divergence signals. For intraday analysis, start with 3-minute charts or higher. For swing trading, use 4H and up for clearer, more reliable structure.
9️⃣ LiquidEdge Settings Overview
A quick breakdown of what you can customize in the indicator and how each option affects what you see:
➡️ LiquidEdge Length
Controls how sensitive the indicator is to changes in volume pressure (via MFI slope).
Shorter values = faster response, more frequent signals
Longer values = smoother output, less noise
👉 Default: 14
➡️ EMA Trend Filter
Determines overall trend direction based on EMA slope. Used to filter out signals that go against the broader move.
Helps reduce countertrend entries
Adjustable to suit your strategy
👉 Recommended: 200 EMA
➡️ Pivot Lookback (Left & Right)
Defines how many bars the system looks back and forward to identify swing highs/lows for divergence detection.
Narrow: more responsive but can be noisy
Wide: slower but more stable pivot zones
👉 Default: 5 left / 5 right
➡️ Histogram Toggle
Enables a visual histogram showing how volume pressure deviates from its recent average.
Useful for spotting shifts in flow intensity
👉 Optional for added visual detail
➡️ Liquidity Zones
Highlights potential exhaustion zones based on MFI value:
Above 80 = potential distribution (buying pressure peaking)
Below 20 = possible accumulation (selling pressure fading)
👉 Zones are fully customizable (color, opacity, background)
➡️ Custom Threshold Zones
Set your own upper/lower boundaries for liquidity extremes helpful when adapting to different markets or asset classes.
👉 Especially useful outside of crypto/forex
➡️ Show LiquidEdge Line
Toggle the main MFI slope line. When turned off, liquidity zones and levels also disappear.
👉 Use if you prefer to focus only on histogram/divergences
➡️ Style Settings
Customize line colors, histogram appearance, and background shading
👉 Helps tailor visuals to your chart layout
➡️ Simplified Mode
Removes all colors and replaces visuals with a clean, grayscale output.
👉 Ideal for minimalist or distraction-free charting
➡️ Signal Score Label
Displays the confidence score of the current setup, based on:
Divergence presence
Liquidity zone positioning
Trend alignment (EMA)
👉 Tooltip explains how the score is calculated
➡️ Divergence Labels
Shows “Bullish” or “Bearish” labels at divergence points.
Optional Filters based on trend if EMA filter is active
➡️ Multi-Timeframe Flow Table
Shows directional flow (based on MFI slope) across: 5M, 15M, 1H, 4H, 1D
Color-coded (faded green/red) for clarity
👉 Table position is customizable on your chart
➡️ Alerts
Get notified when any of these conditions are met:
✅ Bullish or bearish divergence detected
✅ Price enters high/low liquidity zones
✅ Signal score reaches a defined value
➡️ Visibility Settings
Control which timeframes display the LiquidEdge indicator
👉 Best used on 3-minute and above
⚠️ Not recommended on ultra-low or second-based charts due to noise
🔟 Q&A – What Traders Usually Ask
➡️ Can this help reduce bad trades?
To a degree, yes. LiquidEdge is built to highlight areas where price may react, based on volume pressure, liquidity zones, and divergence patterns. It can offer clarity in sideways or messy markets, helping traders avoid impulsive or poorly timed entries.
That said, it’s not predictive or guaranteed. It works best when used with broader context including structure, support/resistance, trend, and volume-based confluence.
👉 Reminder: LiquidEdge is not a signal tool. It’s a decision-support framework designed to help you assess potential shifts, not replace judgment or trading rules.
➡️ Is this just another flashy signal tool?
No. LiquidEdge doesn’t give buy/sell alerts. Instead, it visualizes volume shifts using MFI slope, divergence filtering, and trend-based scoring. It’s built to help you understand why price action may be changing not just react to a one-dimensional signal.
You’re seeing how volume pressure evolves across timeframes, which gives added context to what’s unfolding in the market.
➡️ How do I know this isn’t just another overhyped tool?
LiquidEdge is based on real trading logic: volume pressure (via MFI slope), price behavior, and divergence within trend and liquidity zones. It was developed and tested by traders, not packaged by marketers.
No performance is guaranteed. It’s designed to support your decisions not promise results.
➡️ Will this work with my trading style?
If you trade any market with volume crypto, stocks, or futures LiquidEdge can add value.
✔️ Scalpers: Best from 3-minute and up
✔️ Swing traders: Works well on 4H, Daily, Weekly
✔️ Investors: Weekly charts show pressure buildup over time
⚠️ Avoid ultra-low timeframes (under 1M) or illiquid markets, as noise and irregular data can reduce reliability.
➡️ Can I trust the signals?
These are not buy/sell signals. LiquidEdge offers confidence-weighted insights based on:
✔️ Valid divergence
✔️ Zone positioning (above 80 / below 20)
✔️ Optional trend alignment (via EMA)
Each setup is scored visually to reflect how much confluence exists. You can combine that information with structure, price action, or your existing tools to evaluate opportunities.
👉 Think of LiquidEdge as a decision filter not a trigger.
It’s meant to slow down impulsive trades and help you make more context-aware decisions.
1️⃣1️⃣ Limitations – Know When It’s Less Effective
LiquidEdge performs best in stable, high-volume markets where volume data is consistent and structure is visible.
It’s not recommended for:
❌ Low-volume tokens
❌ Micro-cap or penny stocks
❌ Newly listed assets with limited trading history
These types of markets often show inconsistent or erratic volume behavior, making it difficult for LiquidEdge to accurately assess pressure or identify reliable divergences.
⚠️ During major news events or sudden volatility spikes, volume and price behavior can become disconnected or extreme. This may distort MFI slope calculations and reduce the accuracy of divergence or confidence scoring.
LiquidEdge is built to read structured volume flow. When market conditions become highly erratic or unpredictable, it's best to:
Wait for structure to return
Use it alongside other filters for additional confirmation
This isn't a flaw it's simply the nature of tools that rely on consistency in price and volume data.
1️⃣2️⃣ Real Chart Examples – See It in Action
Now that you’ve seen how LiquidEdge works, here are real-world chart examples from various asset classes
including:
✅ Crypto
✅ Stocks
✅ Futures
✅ Commodities
These examples demonstrate how LiquidEdge behaves under different conditions, and how both the line (MFI slope) and histogram (volume deviation) can be used to interpret market flow.
In each walkthrough, you’ll see:
How the histogram can highlight potential momentum shifts
When the slope line provides stronger directional clarity
Examples of possible hidden accumulation or distribution (before price responds)
What to watch out for such as weak volume, false divergences, or conflicting flow signals
👉 These are real examples based on live market data not theoretical setups. They’re meant to help you recognize how LiquidEdge reacts across multiple styles and timeframes.
Let’s walk through each one and break down the logic step by step, so you can understand how to evaluate setups using structure, volume behavior, and context-driven confluence.
Example: Microsoft (MSFT) – Possible Hidden Accumulation
In this setup, price was moving lower within a short-term downtrend. However, LiquidEdge began showing signs of increasing inflow pressure a common characteristic of accumulation, where volume rises even as price declines.
This divergence suggested that buying interest may have been increasing behind the scenes, despite weak price action on the surface.
Step-by-step breakdown:
👉 Trend context – Price was clearly trending down at the time
👉 Volume divergence – Price made lower lows, but LiquidEdge slope was rising = possible bullish divergence
👉 Accumulation clue – The rising slope, despite falling price, pointed to volume inflow often seen during quiet accumulation
👉 Histogram support – Volume pressure (via the histogram) also increased, confirming the flow shift
👉 Anticipating reaction – When liquidity pressure rises ahead of price, it can signal potential reversal interest
In this case, price later moved sharply higher. While not guaranteed, setups like this illustrate how divergence + volume flow may help highlight early accumulation zones before price confirms the shift.
Same Setup – Focusing on the Histogram Alone
Here, we’re revisiting the Microsoft setup but this time focusing only on the histogram, without the MFI slope line.
Even without the directional slope, the histogram showed rising volume pressure while price continued to drift lower. This visual pattern may indicate that buying interest was quietly increasing, despite weak price movement.
This is where the histogram adds value: it helps visualize the intensity of volume flow over time. When volume pressure builds during a flat or declining price phase, it can be consistent with accumulation where larger participants begin positioning before the market responds.
This example highlights how the histogram alone can provide early insight into underlying volume dynamics even before price shifts noticeably.
Filtering with EMA and why It Matters
Here, we revisit the Microsoft example this time applying the 200 EMA filter, which helps define the broader trend.
Once enabled, LiquidEdge automatically removed any bullish or bearish divergence signals that were against the prevailing trend. This helped reduce noise and focus only on setups aligned with market structure.
✅ The EMA acts as a contextual filter.
For example, if a bullish divergence occurs during a confirmed downtrend, LiquidEdge suppresses that signal helping you avoid setups that may carry more risk.
This filtering mechanism is especially useful in fast or choppy markets, where not all divergences are meaningful.
Want More Flexibility? Adjust the Filter
If you're a more aggressive trader or prefer shorter-term signals, you can reduce the EMA length (e.g., to 150, 50, or even 25). This increases the number of setups shown but also raises the importance of additional context and confirmation.
⚠️ Keep in mind:
❌ More signals doesn’t always mean better outcomes
✅ Focused, context-aware signals tend to be more consistent with broader market pressure
If you’re using this in combination with strategies like options trading, this filter can help refine your entry zones especially when paired with other structure or volatility tools.
Distribution Example and Bitcoin Setup Before a Major Drop
In this example, Bitcoin was trading in a relatively tight range while price continued to push upward. However, LiquidEdge began to show signs of volume outflow, which can suggest potential distribution.
Here’s what was observed:
🔴 Price was moving up inside a horizontal range
🔴 LiquidEdge’s slope indicated declining volume pressure
🔴 Several bearish divergence signals appeared during this consolidation phase
🔴 The histogram also showed weakening flow, even before price broke down
These overlapping signals pointed to a possible distribution phase, where buying momentum was fading despite price still holding up.
🧭 Signs to Watch for in Potential Distribution:
1️⃣ Price holding flat or rising slightly within a tight range
2️⃣ Volume pressure (line or histogram) sloping downward
3️⃣ Repeated bearish divergences forming at the highs
4️⃣ Lack of follow-through on bullish setups signaling hesitation in demand
While LiquidEdge can’t predict market outcomes, this scenario demonstrates how a combination of divergence, outflow, and failure to break out may serve as early warnings that momentum is shifting beneath the surface.
Failed Auction Example – Volume Shift Before a Breakdown
In this example, price attempted to break out above a recent high, creating the appearance of a bullish continuation. However, LiquidEdge began to signal volume outflow, despite the upward price move a potential sign of a failed auction.
Here’s what was observed:
👉 Price made a new high, appearing to break resistance
👉 LiquidEdge slope and histogram both showed declining liquidity
👉 The indicator formed lower lows, even as price pushed higher
👉 This divergence suggested that volume wasn’t supporting the breakout
Shortly after, price reversed and returned back inside the range which is a common characteristic of failed auction behavior.
🧭 Spotting a Potential Failed Auction with LiquidEdge:
1️⃣ Price breaks above a recent high
2️⃣ Volume flow (line + histogram) shows outflow, not inflow
3️⃣ Indicator forms lower lows while price makes higher highs (bearish divergence)
4️⃣ Market reverts back into the previous range without follow-through
While no tool can predict outcomes, this setup demonstrated how volume pressure and divergence can help identify moments where a breakout may lack real support offering context before price action confirms the shift.
Reading the Histogram - Spotting Pressure Fades
In this example, price was still rising but the LiquidEdge histogram showed falling volume pressure. This type of divergence between price and volume can serve as a potential early signal that momentum may be fading.
🔻 Histogram levels declined while price continued higher
🔻 This suggested that buying pressure was weakening, even though price hadn’t turned
🔻 Volume flow behavior didn’t support the continuation possibly indicating buyer exhaustion
Just before the peak, the histogram nearly reached its lower threshold, despite price still being near its highs.
💡 How to Read It:
When volume pressure (shown by the histogram) starts to fade while price is still rising, it can indicate that momentum is weakening. This may precede a pullback or reversal particularly if other factors like divergence or zone exhaustion are also present.
Conversely, rising histogram values during a price drop may suggest potential accumulation.
👉 Use the histogram as a volume intensity gauge, not a signal on its own especially when evaluating whether a move is supported by actual flow, or just price momentum.
The Table – Fast, Visual Multi-Timeframe Flow Insight
The multi-timeframe flow table in LiquidEdge provides a consolidated view of volume momentum across several key timeframes so you don’t need to switch between charts to compare flow strength.
👉 Instead of flipping from 5-minute to 15M, 1H, 4H, and Daily, the table displays flow direction on all of them at a glance.
Example layout:
🔼 Daily: Up
🔽 1H: Down
🔼 15M: Up
🔽 5M: Down
This setup gives you a quick read on whether volume momentum is aligned across multiple timeframes or diverging which can help frame your trade approach.
🧠 Why It’s Useful:
✅ Supports timeframe alignment
If higher timeframes show strong inflow while lower ones are mixed, you may interpret it as a swing-based opportunity. If short timeframes show pressure but higher frames are flat, it might suggest short-term setups with caution.
✅ Improves context awareness
Instead of interpreting a move in isolation, the table helps you assess whether short-term signals are part of a broader shift or going against higher timeframe flow.
💡 Pro Tip: Use the table as a starting point in your analysis. It’s a simple but effective snapshot of current liquidity pressure across the board helping you plan trades with broader context, rather than reacting chart-by-chart.
🔚 Final Thoughts
If you're focused on trading with better clarity and structure, LiquidEdge is designed to help you interpret what’s happening beneath the surface not just follow price movement.
While many tools highlight price alone, LiquidEdge combines volume pressure, divergence filtering, and trend-based context to help identify potential areas of accumulation, distribution, or momentum shifts even before they become obvious on a chart.
👉 This isn’t just another signal tool. It’s a framework to support smarter decision-making:
✔️ One that helps you filter out noise
✔️ One that scores setups using multiple layers of confirmation
✔️ One that brings volume context into every trade idea
Whether you're scalping on a 5-minute chart or managing a longer-term swing trade, LiquidEdge is built to help you stay aligned with volume-driven behavior not just react to price alone.
If you've struggled with late entries, unreliable setups, or second-guessing trades, this tool was designed to bring more structure to your process. It won’t remove all uncertainty but it can help you stay more selective, confident, and intentional.
✅ Trade with clarity
✅ Stay process-driven
✅ Focus on structure, not noise
LiquidEdge is not meant to replace your strategy. It’s here to enhance it.
In this chart, the 200 EMA filter was applied. As a result, only signals that aligned with the dominant trend direction were displayed helping to reduce distractions and focus on setups with stronger context.
💡 Using a higher EMA setting like 200 can reduce the number of signals shown, but may help you focus on higher-conviction opportunities.
That said, every trader is different:
Longer EMAs = fewer signals, but more trend-filtered setups
Shorter EMAs = more signals, faster entries but with potentially more noise
👉 Adjust the filter based on your trading style. Use a 200 EMA for swing trading, or reduce it to 50, 25, or even 5 if you're trading more aggressively or intraday.
LiquidEdge adapts to you not the other way around.
🔁 Adjusting EMA for Your Trading Style
Personal Tip: When trading more aggressively, I often use a 5 EMA filter especially when combining histogram strength with other tools. This increases signal responsiveness and may help highlight short-term flow shifts more quickly.
Below are visual examples that show how different EMA lengths impact the behavior of LiquidEdge:
50 EMA ON
25 EMA ON
5 EMA ON
Lower EMA Example – Gold with the 5 EMA
In this example, the 5 EMA filter was applied to Gold. As expected, more signals were plotted compared to higher EMA settings. The tool became more responsive to rapid shifts in volume momentum, making it more suitable for fast-paced trading environments.
This setting can help traders who prefer early entries but it also introduces more sensitivity, so context and additional confirmation become even more important.
Each setting affects signal frequency and filtering:
Higher EMA → fewer signals, more trend-confirmed setups
Lower EMA → more signals, quicker responses, but with more potential for noise
Choose what fits your approach:
Long-term swing → Stick with 200 EMA
Intraday or scalping → Consider shorter EMAs (50, 25, or 5)
💡 Reminder: EMA filtering is fully adjustable. LiquidEdge doesn’t lock you into one trading style it’s meant to adapt to your process, whether you’re swing trading or scalping short-term moves.
But There’s a Catch…
Using a lower EMA setting (like 5) opens up faster, more frequent signals but it also increases the need for precision and stronger trade management.
❗ More signals = More responsiveness
❗ Faster setups mean quicker decisions
❗ Risk control becomes even more important
💡 Lower Timeframes = More Detail, Less Margin for Error
A short EMA (like 5) can help you:
✅ Identify early momentum shifts
✅ Respond before traditional trend-followers
✅ Highlight short-term divergence and volume changes
But it also comes with tradeoffs:
❌ Greater signal noise
❌ Higher potential for misreads or fakeouts
❌ Requires clear structure and disciplined entries
🚩 Watch Out for Liquidity Grabs
In lower timeframes, a common trap is the liquidity grab where price pushes beyond recent highs or lows, triggers stops, then quickly reverses.
📌 These moves can look like breakouts, but often reverse quickly possibly reflecting institutional order placement or low-liquidity manipulation.
🧭 How to Approach It Smartly
✅ Use structure: Mark support and resistance to frame moves
✅ Confirm volume behavior: Is histogram strength rising or fading?
✅ Avoid chasing: Look for confluence, not just a single signal
✅ Be intentional with stops: Place them with structure in mind to avoid being swept out
NASDAQ Futures Example – Low Timeframe Setups with LiquidEdge
In this example, we look at how LiquidEdge was used to identify both short and long setups on the NASDAQ Futures (NQ) particularly on a low timeframe (5M), where quick decision-making and volume precision matter most.
⚠️ A Note on Futures and Volume
When trading futures, especially on intraday charts, it’s important to separate overnight volume from regular session activity.
🕒 Overnight Volume ≠ Real Volume Context
Overnight price action is informative, but the volume data itself may not reflect true market participation. In LiquidEdge, histogram and pressure calculations emphasize regular session flow helping avoid skewed signals that could come from low-volume overnight moves.
Using the Histogram to Spot Potential Shifts
One of the key cues I use is color transition in the histogram:
🔴 A flip from strong green to red can signal fading buying pressure, sometimes marking the beginning of a potential short setup.
🟢 A shift from red to green may indicate that buyers are returning, suggesting possible accumulation.
These shifts serve as early visual cues of changing pressure especially when confirmed by other tools or context.
🔁 Adding Context with the Line + Structure
After spotting a histogram shift, I look at:
1️⃣ Slope Line – Is it confirming the same directional pressure?
2️⃣ Support/Resistance – Are we near a meaningful zone?
3️⃣ Additional Tools – This includes trendlines, VWAP, EMAs, and overall price structure.
On lower timeframes like 5M, these pieces become even more important. LiquidEdge gives directional insight, but your full setup provides confirmation and execution logic.
⚠️ Disclaimer
LiquidEdge is not a signal tool. It’s a visual representation of market pressure and flow designed to help you make more informed trading and investing decisions. It shows you what’s happening beneath the price action but you are still responsible for your decisions.
Always combine LiquidEdge with your own strategy, research, and supporting tools. That includes trend analysis, support/resistance levels, chart patterns, and fundamentals (like P/E ratios, price-to-sales, debt ratios, etc.).
This tool should never be used alone or treated as financial advice.
Some content may include AI-powered enhancements for clarity or formatting.
Always do your own research. For personal financial guidance, speak with a licensed financial advisor.

Ultra VolumeVisualizes volume intensity using dynamic color gradients and percentile thresholds. Includes optional SMA, bar coloring, and adaptive liquidity boxes to highlight high- and low-volume zones in real time.
Introduction
The Ultra Volume indicator enhances volume analysis by categorizing volume bars into percentile-based intensity levels. It uses color-coded gradients to quickly identify periods of unusually high or low activity. The script also includes an optional simple moving average (SMA), bar coloring, and visual box overlays to highlight zones of significant liquidity shifts.
Detailed Description
.........
Volume Classification
Volume is segmented into five tiers: Extra High, High, Medium, Normal, and Low, using percentile ranks calculated over a dynamically adjusted historical window. This segmentation adapts based on the chart's timeframe – using 100 bars for daily and 1440/minutes for intraday – allowing for consistent behavior across resolutions.
.....
Color Gradients
Each volume bar is colored based on its percentile category, smoothly transitioning between thresholds for visual clarity. This makes it easy to spot volume spikes or droughts relative to recent history.
.....
Simple Moving Average (SMA)
An optional SMA can be plotted on top of the volume bars for trend comparison and baseline reference. Its length and color are fully customizable.
.....
Bar Coloring
You can optionally color the chart's candlesticks to reflect the same volume intensity as the histogram bars, reinforcing visual cues across the chart.
.....
Liquidity Boxes
Two adaptive box systems highlight zones of increased or decreased liquidity:
High Liquidity Boxes expand upward when price exceeds the previous box’s top.
Low Liquidity Boxes expand downward when price breaks the previous box’s bottom.
These boxes persist and auto-adjust over time unless reset, helping traders spot key zones of volume-driven price action.
.....
Box Indexing
A configurable index shift determines how far back in the chart the boxes originate. Setting this to 501 makes them "stick" to the candle where they were first created.
.....
Data Handling
A safety check ensures the script throws an error if volume data is unavailable (e.g., for some crypto or CFD symbols).
.........
Summary
Ultra Volume is a practical tool for traders who want more than just raw volume bars. With intelligent percentile-based classification, real-time adaptive liquidity zones, and fully customizable visual elements, it turns volume into a highly readable, actionable signal.

Levels Of Interest------------------------------------------------------------------------------------
LEVELS OF INTEREST (LOI)
TRADING INDICATOR GUIDE
------------------------------------------------------------------------------------
Table of Contents:
1. Indicator Overview & Core Functionality
2. VWAP Foundation & Historical Context
3. Multi-Timeframe VWAP Analysis
4. Moving Average Integration System
5. Trend Direction Signal Detection
6. Visual Design & Display Features
7. Custom Level Integration
8. Repaint Protection Technology
9. Practical Trading Applications
10. Setup & Configuration Recommendations
------------------------------------------------------------------------------------
1. INDICATOR OVERVIEW & CORE FUNCTIONALITY
------------------------------------------------------------------------------------
The LOI indicator combines multiple VWAP calculations with moving averages across different timeframes. It's designed to show where institutional money is flowing and help identify key support and resistance levels that actually matter in today's markets.
Primary Functions:
- Multi-timeframe VWAP analysis (Daily, Weekly, Monthly, Yearly)
- Advanced moving average integration (EMA, SMA, HMA)
- Real-time trend direction detection
- Institutional flow analysis
- Dynamic support/resistance identification
Target Users: Day traders, swing traders, position traders, and institutional analysts seeking comprehensive market structure analysis.
------------------------------------------------------------------------------------
2. VWAP FOUNDATION & HISTORICAL CONTEXT
------------------------------------------------------------------------------------
Historical Development: VWAP started in the 1980s when big institutional traders needed a way to measure if they were getting good fills on their massive orders. Unlike regular price averages, VWAP weighs each price by the volume traded at that level. This makes it incredibly useful because it shows you where most of the real money changed hands.
Mathematical Foundation: The basic math is simple: you take each price, multiply it by the volume at that price, add them all up, then divide by total volume. What you get is the true "average" price that reflects actual trading activity, not just random price movements.
Formula: VWAP = Σ(Price × Volume) / Σ(Volume)
Where typical price = (High + Low + Close) / 3
Institutional Behavior Patterns:
- When price trades above VWAP, institutions often look to sell
- When it's below, they're usually buying
- Creates natural support and resistance that you can actually trade against
- Serves as benchmark for execution quality assessment
------------------------------------------------------------------------------------
3. MULTI-TIMEFRAME VWAP ANALYSIS
------------------------------------------------------------------------------------
Core Innovation: Here's where LOI gets interesting. Instead of just showing daily VWAP like most indicators, it displays four different timeframes simultaneously:
**Daily VWAP Implementation**:
- Resets every morning at market open
- Provides clearest picture of intraday institutional sentiment
- Primary tool for day trading strategies
- Most responsive to immediate market conditions
**Weekly VWAP System**:
- Resets each Monday (or first trading day)
- Smooths out daily noise and volatility
- Perfect for swing trades lasting several days to weeks
- Captures weekly institutional positioning
**Monthly VWAP Analysis**:
- Resets at beginning of each calendar month
- Captures bigger institutional rebalancing at month-end
- Fund managers often operate on monthly mandates
- Significant weight in intermediate-term analysis
**Yearly VWAP Perspective**:
- Resets annually for full-year institutional view
- Shows long-term institutional positioning
- Where pension funds and sovereign wealth funds operate
- Critical for major trend identification
Confluence Zone Theory: The magic happens when multiple VWAP levels cluster together. These confluence zones often become major turning points because different types of institutional money all see value at the same price.
------------------------------------------------------------------------------------
4. MOVING AVERAGE INTEGRATION SYSTEM
------------------------------------------------------------------------------------
Multi-Type Implementation: The indicator includes three types of moving averages, each with its own personality and application:
**Exponential Moving Averages (EMAs)**:
- React quickly to recent price changes
- Displayed as solid lines for easy identification
- Optimal performance in trending market conditions
- Higher sensitivity to current price action
**Simple Moving Averages (SMAs)**:
- Treat all historical data points equally
- Appear as dashed lines in visual display
- Slower response but more reliable in choppy conditions
- Traditional approach favored by institutional traders
**Hull Moving Averages (HMAs)**:
- Newest addition to the system (dotted line display)
- Created by Alan Hull in 2005
- Solves classic moving average dilemma: speed vs. accuracy
- Manages to be both responsive and smooth simultaneously
Technical Innovation: Alan Hull's solution addresses the fundamental problem where moving averages are either too slow (missing moves) or too fast (generating false signals). HMAs achieve optimal balance through weighted calculation methodology.
Period Configuration:
- 5-period: Short-term momentum assessment
- 50-period: Intermediate trend identification
- 200-period: Long-term directional confirmation
------------------------------------------------------------------------------------
5. TREND DIRECTION SIGNAL DETECTION
------------------------------------------------------------------------------------
Real-Time Momentum Analysis: One of LOI's best features is its real-time trend detection system. Next to each moving average, visual symbols provide immediate trend assessment:
Symbol System:
- ▲ Rising average (bullish momentum confirmation)
- ▼ Falling average (bearish momentum indication)
- ► Flat average (consolidation or indecision period)
Update Frequency: These signals update in real-time with each new price tick and function across all configured timeframes. Traders can quickly scan daily and weekly trends to assess alignment or conflicting signals.
Multi-Timeframe Trend Analysis:
- Simultaneous daily and weekly trend comparison
- Immediate identification of trend alignment
- Early warning system for potential reversals
- Momentum confirmation for entry decisions
------------------------------------------------------------------------------------
6. VISUAL DESIGN & DISPLAY FEATURES
------------------------------------------------------------------------------------
Color Psychology Framework: The color scheme isn't random but based on psychological associations and trading conventions:
- **Blue Tones**: Institutional neutrality (VWAP levels)
- **Green Spectrum**: Growth and stability (weekly timeframes)
- **Purple Range**: Longer-term sophistication (monthly analysis)
- **Orange Hues**: Importance and attention (yearly perspective)
- **Red Tones**: User-defined significance (custom levels)
Adaptive Display Technology: The indicator automatically adjusts decimal places based on the instrument you're trading. High-priced stocks show 2 decimals, while penny stocks might show 8. This keeps the display incredibly clean regardless of what you're analyzing - no cluttered charts or overwhelming information overload.
Smart Labeling System: Advanced positioning algorithm automatically spaces all elements to prevent overlap, even during extreme zoom levels or multiple timeframe analysis. Every level stays clearly readable without any visual chaos disrupting your analysis.
------------------------------------------------------------------------------------
7. CUSTOM LEVEL INTEGRATION
------------------------------------------------------------------------------------
User-Defined Level System: Beyond the calculated VWAP and moving average levels, traders can add custom horizontal lines at any price point for personalized analysis.
Strategic Applications:
- **Psychological Levels**: Round numbers, previous significant highs/lows
- **Technical Levels**: Fibonacci retracements, pivot points
- **Fundamental Targets**: Analyst price targets, earnings estimates
- **Risk Management**: Stop-loss and take-profit zones
Integration Features:
- Seamless incorporation with smart labeling system
- Custom color selection for visual organization
- Extension capabilities across all chart timeframes
- Maintains display clarity with existing indicators
------------------------------------------------------------------------------------
8. REPAINT PROTECTION TECHNOLOGY
------------------------------------------------------------------------------------
Critical Trading Feature: This addresses one of the most significant issues in live trading applications. Most multi-timeframe indicators "repaint," meaning they display different signals when viewing historical data versus real-time analysis.
Protection Benefits:
- Ensures every displayed signal could have been traded when it appeared
- Eliminates discrepancies between historical and live analysis
- Provides realistic performance expectations
- Maintains signal integrity across chart refreshes
Configuration Options:
- **Protection Enabled**: Default setting for live trading
- **Protection Disabled**: Available for backtesting analysis
- User-selectable toggle based on analysis requirements
- Applies to all multi-timeframe calculations
Implementation Note: With protection enabled, signals may appear one bar later than without protection, but this ensures all signals represent actionable opportunities that could have been executed in real-time market conditions.
------------------------------------------------------------------------------------
9. PRACTICAL TRADING APPLICATIONS
------------------------------------------------------------------------------------
**Day Trading Strategy**:
Focus on daily VWAP with 5-period moving averages. Look for bounces off VWAP or breaks through it with volume. Short-term momentum signals provide entry and exit timing.
**Swing Trading Approach**:
Weekly VWAP becomes your primary anchor point, with 50-period averages showing intermediate trends. Position sizing based on weekly VWAP distance.
**Position Trading Method**:
Monthly and yearly VWAP provide broad market context, while 200-period averages confirm long-term directional bias. Suitable for multi-week to multi-month holdings.
**Multi-Timeframe Confluence Strategy**:
The highest-probability setups occur when daily, weekly, and monthly VWAPs cluster together, especially when multiple moving averages confirm the same direction. These represent institutional consensus zones.
Risk Management Integration:
- VWAP levels serve as dynamic stop-loss references
- Multiple timeframe confirmation reduces false signals
- Institutional flow analysis improves position sizing decisions
- Trend direction signals optimize entry and exit timing
------------------------------------------------------------------------------------
10. SETUP & CONFIGURATION RECOMMENDATIONS
------------------------------------------------------------------------------------
Initial Configuration: Start with default settings and adjust based on individual trading style and market focus. Short-term traders should emphasize daily and weekly timeframes, while longer-term investors benefit from monthly and yearly level analysis.
Transparency Optimization: The transparency settings allow clear price action visibility while maintaining level reference points. Most traders find 70-80% transparency optimal - it provides a clean, unobstructed view of price movement while maintaining all critical reference levels needed for analysis.
Integration Strategy: Remember that no indicator functions effectively in isolation. LOI provides excellent context for institutional flow and trend direction analysis, but should be combined with complementary analysis tools for optimal results.
Performance Considerations:
- Multiple timeframe calculations may impact chart loading speed
- Adjust displayed timeframes based on trading frequency
- Customize color schemes for different market sessions
- Regular review and adjustment of custom levels
------------------------------------------------------------------------------------
FINAL ANALYSIS
------------------------------------------------------------------------------------
Competitive Advantage: What makes LOI different is its focus on where real money actually trades. By combining volume-weighted calculations with multiple timeframes and trend detection, it cuts through market noise to show you what institutions are really doing.
Key Success Factor: Understanding that different timeframes serve different purposes is essential. Use them together to build a complete picture of market structure, then execute trades accordingly.
The integration of institutional flow analysis with technical trend detection creates a comprehensive trading tool that addresses both short-term tactical decisions and longer-term strategic positioning.
------------------------------------------------------------------------------------
END OF DOCUMENTATION
------------------------------------------------------------------------------------

Gann Single SwingGann Single Swing Indicator
The Gann Single Swing indicator is a sophisticated tool rooted in the geometric and cyclical market analysis principles pioneered by William Delbert Gann. Designed for traders who value deep market structure analysis, this indicator leverages the interplay of price and time to identify key support and resistance zones, potential reversal points, and critical price-time synchronization areas. Its unique approach makes it an invaluable instrument for those employing Gann-based methodologies or seeking a systematic way to decode complex market dynamics.
What It Does
The Gann Single Swing indicator is built to pinpoint high-probability zones for price action, such as support and resistance levels, where traders can logically initiate long or short positions. By analyzing a user-defined price swing (a move between two selected points, such as a local high and low), the indicator constructs a geometric framework that reveals hidden patterns in market movements. It identifies:
Support and Resistance Zones: Key price levels where the market is likely to reverse or consolidate.
Temporal Reversal Zones: Specific time periods where price reversals are more probable due to time-price resonance.
Price-Time Synchronization Points: Areas where price and time align to signal potential market turning points.
How It Works
The indicator’s algorithm is grounded in Gann’s geometric principles, focusing on the relationship between price movements and time cycles. Here’s a high-level overview of its process:
Swing Selection: Traders select two key points on the chart (e.g., a local minimum and maximum) to define a price swing.
Channel Construction: The swing is encapsulated within a dynamic channel, forming the foundation of the geometric model.
Gann Fan Application: A Gann Fan is applied to the channel to calculate critical angles, representing the balance between price and time. These angles help identify resonant points that align with the channel’s central axis.
Squared Channel Analysis: The algorithm creates “squared” channels, geometrically derived sub-structures, analyzed for intersections and alignments to project external support and resistance zones beyond the base swing.
Internal Zone Mapping: Within the base swing, a reverse Gann Fan maps internal zones, highlighting areas of price-time convergence that may act as dynamic support or resistance.
Zone Projection: The indicator synthesizes these calculations to plot precise zones of support, resistance, and potential reversals, both spatially (price levels) and temporally (time-based zones).
While the exact mathematical formulations remain proprietary, the indicator relies on time-tested Gann techniques, such as angle-based analysis and cyclical resonance, to deliver actionable insights.
How to Use It
Select the Swing: Identify two significant points on the chart (e.g., a recent high and low) to define the swing. These points serve as the anchor for the indicator’s calculations.
Interpret the Zones: The indicator plots support and resistance zones (both price-based and time-based). Look for price action near these zones to identify potential entry or exit points.
Combine with Other Tools: For best results, use alongside other Gann-based tools (e.g., Gann Squares or Time Cycles) or traditional technical analysis (e.g., trendlines, Fibonacci levels) to confirm signals.
Monitor Temporal Zones: Pay attention to time-based reversal zones, as they may indicate when a price move is likely to occur, enhancing trade timing.
Why It’s Unique
Unlike conventional indicators that rely on moving averages, RSI, or other common metrics, the Gann Single Swing indicator offers a proprietary blend of Gann’s geometric and cyclical principles. Its ability to integrate price and time into a cohesive model sets it apart, providing traders with a deeper understanding of market structure. The indicator does not use public domain code or standard technical indicators, ensuring originality and value for traders seeking advanced tools.
Who It’s For
This indicator is ideal for:
Traders familiar with Gann’s methodologies who want to automate and enhance their geometric analysis.
Advanced traders looking to uncover hidden market patterns through price-time relationships.
Those seeking a robust, non-traditional tool for identifying high-probability trade setups.
The Gann Single Swing indicator is not a black-box forecasting tool but a powerful framework for dissecting market behavior. By combining user-defined inputs with sophisticated geometric calculations, it empowers traders to make informed decisions based on the timeless principles of Gann’s market philosophy.

Visual ProwessVisual Prowess: Ultimate Visual of Price Action Indicator
Overview
Visual Prowess is a Pine Script indicator that integrates Trend, Momentum, Strength/Weakness, Money Flow, and Volatility into a single, intuitive interface. Scaled from 0 to 100, it provides traders with clear bullish (>50) and bearish (<50) zones. Visual Prowess is made up of several data components which will be explained below. All these components have custom thresholds that lead to Green Dot Buy Signals and Red Dot sell signals. Designed for multi-timeframe analysis, it helps traders anticipate market moves with precision seeing behind the scenes of price action.
The fundamental inputs of price action are made up of different variables -- the components of Trend Strength, Volatility, Momentum, Money Flow/Volume and Overbought/Oversold. These are very important inputs market makers use. From what I've learned in my trading journey (always still learning), this is the data I value most important. This is why I combined all these components into one indicator.....to be an ultimate visual—this extrapolation of different pieces of data is the Visual Prowess.
What It Does
Visual Prowess combines five key market factors into a unified score (0-100) to assess market conditions by examining the price action like an x-ray aka Visual Prowess:
• Trend Direction & Strength (Green and Red Wave) : Identifies bullish (green clouds) or bearish (red clouds) trend. This data is designed to illustrate the trend by the color, and its strength by the height (score).
How it is Calculated = Data is derived from price action-- comparing the current and previous price highs and lows to measure the strength of upward (+) or downward (-) price movements, smoothed over a period and expressed as a percentage of the price range.
• Momentum (Blue and White Wave): Tracks price acceleration via a custom momentum oscillator, displayed as blue (positive) or white (negative) waves.
How it is Calculated = Data is calculated by subtracting a longer-term exponential moving average from a shorter-term exponential moving average to measure momentum and trend direction. Momentum strength is measured by height on 0-100 score, and color dictates the trend-- Blue up, White down.
• Strength Index (Purple Line): Measures overbought/oversold conditions with a normalized index, derived from price deviation.
How it is Calculated = Strength Index is calculated by comparing the average of price gains to the average of price losses over a specified period, expressed as a value between 0 and 100 to measure momentum and identify overbought or oversold conditions.
• Money Flow: Monitors capital inflows and outflows using a modified Money Flow Index, shown as green (buying) or red (selling) circles.
How it is Calculated = The Money Flow is calculated by using price and volume data to measure buying and selling pressure, comparing positive and negative money flow over a specified period to produce a value between 0 and 100, indicating overbought or oversold conditions and more importantly where the money is moving, + or -.
• Volatility: Gauges market volatility, marked by colored crosses (blue for low, red for high). Blue illustrates low volatility which is key for big moves either + or -; red to illustrate when price action is extremely overheated either + or -.
How it is Calculated = The volatility is calculated by the creator of the BBWP The_Caretaker. This excellent work is calculated using the width of the iconic indicator the Bollinger Bands (the difference between the upper and lower bands divided by the middle band (the moving average), expressed as a percentage to show how volatile the price is relative to its recent average.
Originality
Unlike traditional multi-indicator dashboards, Visual Prowess uses a combination of specific open-source indicators which I believe to be the most important inputs in price action-- trend, momentum, strength, money flow, and volatility into an all-in-one visual ratioed on a 0-100 scale. This unique synthesis of data reduces noise, prioritizes signal alignment, and a look behind the scenes of price action to see deeper into the movement – This combination of indicators has custom thresholds, when these components in alignment with each other hit certain parameters; it leads to key custom price action signals -- Green Dot Buy and Red Dot Sell signals.
There is also a bonus indicator….. a Yellow Triangle. When you see this, it is rare and strong. It only prints when strength index reaches extreme lows at the same time volatility reaches extreme highs…. It then waits to print the yellow triangle upon a third condition= which is price action is back in bullish/positive zone. This Yellow triangle is meant to be strong reversals of Macro Trend lows.
How to Use the Visual Prowess Components:
• Add to Chart: Apply Visual Prowess to any timeframe (recommended: higher timeframes 12H, 1D, 2D, 3D for optimal signals).
• Interpret Zones: Values >50 indicate bullish conditions (green background); <50 signal bearish conditions (red background).
Wait for Green Dot Buy signal for buys and Red Dot Sell signals for sells. One can read each component individually to gauge the price action and predict before the buy signal prints; all of those components merged together is what leads to the buy and sell signals. The story of what’s to come can be seen at lower timeframes before the higher timeframes print, that is a key way to gauge projections of bull or bear prints to come.
HOW TO READ EACH DATA COMPONENT
TREND CLOUDS: Green/red clouds show trend direction; vivid colors tied to number/ score on the 0-100 scale indicate strength of the trend.
Bull Conditions
Green cloud illustrates the trend is bullish. The height is correlated to the trend’s strength—this height is also aligned with colors, more transparent green is weak, then it gets more opaque being medium strength, and the most vibrant is the strongest. How to ride the bull condition is by seeing this transformation of trend get from weak to strong, until it tops out and the wave points down losing strength which alludes to the bear condition.
Bear Conditions
Vice versa with the bear condition. Different shades of red tie into the strength of the bear trend. How to read when things are about to get bearish, is by seeing bull trend shift levels of strength (Example- medium to weak). This transition of bull strength getting weaker is the start, once it gets to weak bear it has commenced until bearish strength tops out before it begins to get weaker leading to the next bull phase.
MOMENTUM WAVES: Blue waves above 50 suggest bullish momentum; white waves below 50 warn of bearish shifts.
Bull Conditions
Good to look at flips of white wave to blue in bearish zones to see the tide turning= guaranteed bullish when safely gets above and holds above 50 zone.
Bear Conditions
Vice versa for Bearish side of this momentum wave being blue wave turning white in bullish zone aiming down to break below 50 zone to confirm bearish descent.
STRENGTH INDEX: Values >80 indicate overbought; <20 suggest oversold. Look for “Bull” or “Bear” labels for divergences.
Bull Conditions
Above 50 level is key, so seeing price action break from below 50 to above 50 is strong buy condition until it gets overbought.
Bear Conditions
Once conditions are too overbought and falling making lower lows (especially when price action is climbing or staying sideways) it is indicating strength is getting weaker. When this indicator fights 50 level and breaks down below 50 level bearish conditions are coming until it gets to an oversold level.
MONEYFLOW: Green circles signal buying pressure; red circles indicate selling.
Bull Conditions
Green circles show money flow is positive so that’s a good sign of upward price action to come, and again above 50 level is bullish conditions
Bear Conditions
Red circles show money flow is negative so that’s a bad sign of price action to come, pointing down and breaking below 50 level is no good. It can have corrections in bullish scenario keep in mind seeing red doesn’t mean trend is over z9could be in higher low scenario).
VOLATILITY: Blue crosses (<25% volatility) suggest breakout potential; red crosses (>75%) warn of overheated markets.
Bull Conditions
This is a very important indication. Big volatile moves can move either direction + or -. When all other components look positive/bullish and this is signalling blue crosses it means a big move is coming and will most likely be in the upward direction –If all other components align/lean bullish.
Another bullish scenario is when price action is down large and red crosses are forming. This indicates that the downward move is overheated (red x’s are rare). This extremely oversold condition can be great buying opportunities when volatility is hot printing red x’s.
Bear Conditions
When all other components look negative/bearish and this is signalling blue crosses it means a big move is coming and will most likely be in the downward direction –If all other components align/lean bearish.
Another bearish scenario is when price action is up large and red crosses are forming. This indicates that the upward move is overheated (red x’s are rare). This extremely overbought condition can be great selling opportunities when volatility is hot printing red x’s.
*****All these components in alignment of hitting each pertaining important threshold--is what prints the green dot and sell signals to trade by. It is not black and white; each component has a sweet spot fine tuned to be triggered through analysis of what is happening individually to each component and how it is reacting to the price action data.
EXAMPLE= Taking a look at the screenshot (Perfect Scenario)
Bullish Examination
- Taking a look at the 2-D timeframe on BTC
x>50
x= all components traveling to the bullish zone. Blue wave, Strength Index with bullish divergence accumulation, Money Flow Positive with Green Trend Wave starting, with teal low volatility cross→→→ leads to Green Dot Buy Signal print…. And the big rise speaks for itself with price action and the big mountain wave of the Green Trend Wave.
This rise leads to
↓↓↓↓
Bearish Examination
Strength Index gets really high at 80 scale, Red X’s showing extremely heated Volatility, Money Flow turning red and sloping down, Trend Wave peaking starting to roll over, Blue Momentum Wave transitioning to white, bearish divergence of price action related to Strength Index→→→ leads to Red Dot Sell Signal print… and the flush speaks for itself when all components fall below 50 level with Trend wave turning red
All this is forecasted in the data, showing weakness before weakness and showing strength before strength. It works because every single piece of important elements in data of price action is incorporated in this all-in-one indicator…. Which leads to the reasoning of me calling this indicator the Visual Prowess, for its unprecedent sharpness of visual observation.
****This is a passion script incorporating every piece of data I value important when reading a chart — to see current perspective of a chart and to help foresee future projection of direction Up or Down. Any community feedback is greatly appreciated. Ongoing work will be done on this script as new thoughts and fine tuning will continuously be done for infinity, as this is my personal go to model for data on the markets.

Volume Profile (PRO) [ActiveQuants]The Volume Profile (PRO) indicator is an advanced analytical tool designed to provide traders with a deep understanding of market dynamics by displaying trading activity across different price levels over a specified period. By meticulously plotting volume distribution , this indicator helps identify significant price zones, such as areas of high acceptance ( High Volume Nodes - HVNs ), rejection ( Low Volume Nodes - LVNs ), Volume Peaks Clusters , Volume Troughs Clusters , the Point of Control (POC) , and the Value Area (VA) . This insight is crucial for spotting potential support/resistance levels, assessing market sentiment, and making more informed trading decisions.
This indicator operates on the principle that price levels with higher traded volume hold greater significance, often acting as pivotal points for future price movements. Conversely, areas with low volume typically indicate less agreement on price, leading to quicker price transitions. The Volume Profile (PRO) offers extensive customization to tailor the analysis to your specific needs and trading style.
█ KEY FEATURES
Comprehensive Volume Analysis: Visualize volume distribution horizontally, revealing key price levels based on actual traded volume.
Dynamic Profile Calculation: Uses a rolling lookback period to keep the profile relevant to recent price action.
Point of Control (POC): Automatically identifies and plots the price level with the highest traded volume within the profile period. Available as a "Regular" (fixed for the current profile) or "Developing" line that tracks its evolution bar-by-bar.
Value Area (VA): Highlights the price range where a specified percentage (typically 70%) of the total volume was traded. Also available as "Regular" or "Developing" VAH (Value Area High) and VAL (Value Area Low) lines.
High and Low Volume Nodes (HVNs & LVNs): Option to automatically detect and highlight a specified number of the highest volume concentration zones (HVNs) and lowest volume zones (LVNs) within the profile. These are crucial for identifying support/resistance and areas of potential quick price movement.
Volume Peaks and Troughs Detection: Identify statistically significant high-volume (Peaks) and low-volume (Troughs) rows relative to their neighbors, either as single rows or clusters. These can pinpoint precise levels of interest.
Multiple Volume Display Types: Choose to display volume as:
- Up/Down: Shows buying and selling volume side-by-side for each row.
- Total: Shows the aggregate volume for each row.
- Delta: Shows the difference between buying and selling volume for each row, highlighting imbalances.
Extensive Customization: Fine-tune lookback period, number of rows, profile width, horizontal placement, Value Area percentage, colors for all elements, and specific parameters for node/peak/trough detection.
Visual Enhancements:
- Optional gradient colors for volume bars.
- Display volume figures directly on rows.
- Background shading for the Value Area and the entire Profile range.
- Price labels for POC, VAH, VAL, Profile High, and Profile Low.
Integrated Alert System: Pre-built alert conditions for critical volume profile events. (See section on "█ SETTING UP ALERTS " for more details).
█ USER INPUTS
The settings panel is organized into distinct sections:
- Calculation Settings:
Lookback: Number of most recent bars for profile calculation.
Number of Rows: Resolution of the volume profile.
Profile Width: Relative horizontal length of the volume bars.
Horizontal Offset: Horizontal positioning of the profile.
Value Area (%): Percentage of volume to include in the Value Area.
Volume: Display type ("Up/Down", "Total", "Delta").
Profile Placement: "Right" or "Left" side of the chart.
- Appearance:
Volume Profile On/Off: Toggle visibility of the entire profile.
Rows Border Width & Color: Customize the outline of volume rows.
Gradient Colors: Enable/disable gradient coloring for volume bars.
Row Volume: Display numerical volume on each row.
VAH (Value Area High): Display type ("None", "Regular", "Developing"), Color, Price Label, Line Width.
VAL (Value Area Low): Display type ("None", "Regular", "Developing"), Color, Price Label, Line Width.
Profile High Price Label & Color: Toggle and customize.
Profile Low Price Label & Color: Toggle and customize.
Value Area Up/Down Color: Colors for up/down volume within VA.
Profile Up/Down Color: Colors for up/down volume outside VA.
Total Volume Color: For "Total" volume display type.
Delta Volume Positive/Negative Color: For "Delta" volume display type.
POC (Point of Control): Display type ("None", "Regular", "Developing"), Color, Line Width, Price Label.
Value Area Background & Color: Enable and customize VA background shading.
Profile Background & Color: Enable and customize profile range background shading.
Volume Nodes:
Highest Volume Nodes & Color: Number of HVNs to highlight and their color.
Lowest Volume Nodes & Color: Number of LVNs to highlight and their color.
Volume Peaks: Detection type ("None", "Single Row", "Cluster"), Color.
Compared Neighbors (Peaks): Number of neighboring rows to compare against for peak detection.
Minimum Peak Ratio (Peaks): Volume ratio required for a row to be considered a peak.
Volume Troughs: Detection type ("None", "Single Row", "Cluster"), Color.
Compared Neighbors (Troughs): Number of neighboring rows to compare against for trough detection.
Minimum Trough Ratio (Troughs): Volume ratio required for a row to be considered a trough.
█ SETTING UP ALERTS
The Volume Profile (PRO) indicator comes with a comprehensive set of pre-configured alert conditions to notify you of key market events related to volume structure. To set up an alert:
Click the " Alert " button (clock icon) on TradingView's right-hand toolbar or top panel.
In the " Condition " dropdown, select " Volume Profile (PRO) ".
A second dropdown will appear, allowing you to choose from the following specific alert conditions built into the script:
- POC Price Change: Triggers when the Point of Control price level changes.
- POC Crossover: Triggers when the closing price crosses over the POC line and is now above it.
- POC Crossunder: Triggers when the closing price crosses under the POC line and is now below it.
- Close Inside Value Area: Triggers when the closing price enters the Value Area.
- Close Outside Value Area: Triggers when the closing price exits the Value Area.
- Close Inside High Volume Node: Triggers when the closing price enters a detected High Volume Node.
- Close Inside Low Volume Node: Triggers when the closing price enters a detected Low Volume Node.
- Close Inside Volume Peak: Triggers when the closing price enters a detected Volume Peak row.
- Close Inside Volume Peak Cluster: Triggers when the closing price enters the area of a Volume Peak cluster.
- Close Inside Volume Trough: Triggers when the closing price enters a detected Volume Trough row.
- Close Inside Volume Trough Cluster: Triggers when the closing price enters the area of a Volume Trough cluster.
Choose your preferred " Trigger " option:
- " Only Once ": The alert triggers the first time the condition is met.
- " Once Per Bar Close ": ( Recommended for most profile signals ) The alert triggers only after the current bar closes if the condition was true on that closed bar. This ensures signals are based on confirmed price action.
Customize the alert name, message, and notification preferences.
Click " Create ".
█ STRATEGY EXAMPLES
The following examples are for illustrative purposes only to demonstrate how the Volume Profile (PRO) can be used. They are not financial advice. Always conduct thorough backtesting and research.
1. POC as Dynamic Support/Resistance
Goal: Identify potential bounces or rejections from the Point of Control.
Setup: Enable "POC Line" (Regular or Developing) and observe price interaction.
Entry (Long):
- Price approaches the POC from above and shows signs of holding (e.g., bullish candlestick patterns, deceleration).
- Enter on confirmation of support at the POC.
Entry (Short):
- Price approaches the POC from below and shows signs of rejection (e.g., bearish candlestick patterns).
- Enter on confirmation of resistance at the POC.
Management: Stop-loss beyond the recent swing pivot or the POC itself after a confirmed break. Target the next significant volume node (HVN/LVN) or Value Area boundary.
2. Trading Low Volume Nodes (LVNs) as "Vacuum Zones"
Goal: Capitalize on rapid price movement through LVNs and their potential to become support/resistance once traversed.
Setup: Enable "Lowest Volume Nodes" to identify LVNs.
Entry (Long):
- Price breaks decisively above an LVN.
- Look for a retest of the top of the LVN as support. Enter long on confirmation.
Entry (Short):
- Price breaks decisively below an LVN.
- Look for a retest of the bottom of the LVN as resistance. Enter short on confirmation.
Concept: Price is expected to move quickly through LVNs (volume vacuum). Once price has passed through an LVN, that area of prior low acceptance can act as a new support/resistance zone.
Management: Stop-loss beyond the retested LVN. Target the next HVN or significant price level.
█ CONCLUSION
The Volume Profile (PRO) indicator offers a sophisticated and highly customizable approach to volume analysis. By providing clear visualizations of POC, Value Area, HVNs, LVNs, and Volume Peaks/Troughs, along with integrated alerts and developing levels, this tool empowers traders to identify critical price zones, understand market structure, and develop more nuanced trading strategies. Whether you're looking for precise entry points, areas of support and resistance, or confirmation of market sentiment, this Volume Profile indicator is an invaluable addition to your technical analysis toolkit.
█ IMPORTANT NOTES
⚠ Lookback vs. Calculated Bars Relationship: The value set in the " Lookback " input ( Calculation Settings ) must be less than half of the number of bars the indicator is set to calculate on your chart (referred to as " Calculated bars " in the script, typically controlled by TradingView's historical data loading or a calc_bars_count setting within the script's indicator() declaration – in this script, it is 1200 bars by default). For example, if "Calculated bars" is 1200, your Lookback should be less than 600. The default Lookback of 500 respects this. Setting a Lookback too high relative to available calculated bars can lead to errors or incorrect profile rendering.
⚠ Parameter Optimization: The default settings are starting points. Always adjust indicator parameters (Lookback, Number of Rows, VA%, etc.) based on the specific asset, its volatility, and the timeframe you are trading. Thorough backtesting is crucial.
⚠ Context is Key: Volume Profile is powerful, but its signals are best interpreted within the broader market context (trend, news, other technical indicators).
⚠ Lookback vs. Profile Stability: A shorter lookback makes the profile very responsive to recent action but less stable. A longer lookback provides more stable levels but may lag in fast-moving markets.
⚠ Number of Rows: Higher row counts offer more granularity but can impact performance and may show too much noise. Lower row counts offer a broader view but may obscure finer details.
⚠ Alert Confirmation: Using " Once Per Bar Close " for alerts is generally recommended to ensure signals are based on confirmed price action.
█ RISK DISCLAIMER
Trading involves a substantial risk of loss and is not suitable for all investors. The Volume Profile (PRO) indicator is provided for educational and informational purposes only . It does NOT constitute financial advice or a recommendation to buy or sell any asset. Indicator signals identify potential patterns based on historical data but do not guarantee future price movements or profitability. Always conduct your own thorough research, utilize multiple sources of information, and implement robust risk management practices before making any trading decisions. Past performance is not indicative of future results.
📊 Happy trading! 🚀
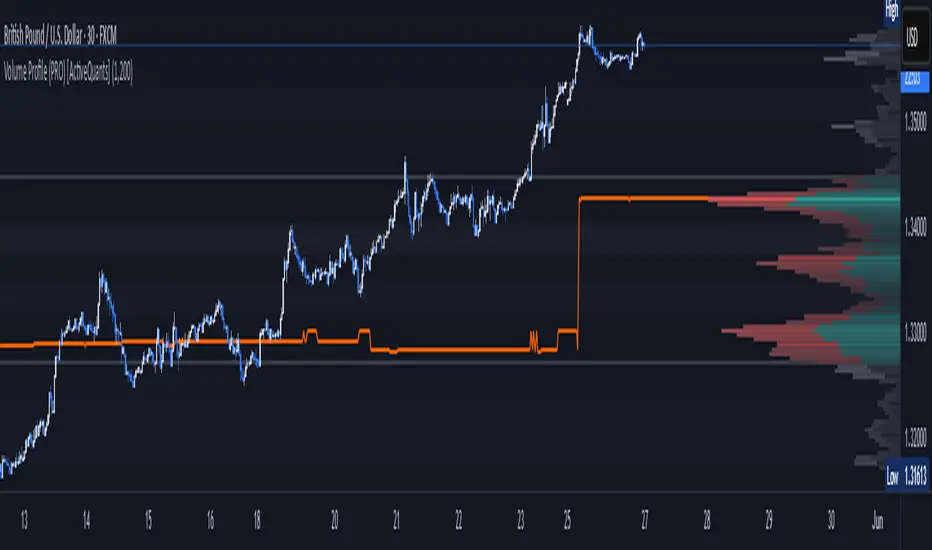
Volume Candle Color (Continuous)Volume-Based Candle Color Indicator (Continuous Gradient)
Overview
Transform your charts with this advanced volume visualization tool that colors candles based on relative volume intensity using a smooth, continuous gradient . Unlike traditional step-based volume indicators, this script provides nuanced color transitions that make volume anomalies instantly visible.
Key Features
Continuous Color Gradient
Smooth transitions - No more discrete color steps
High volume = Bright, opaque colors that demand attention
Low volume = Faded, transparent colors that blend into background
Real-time adaptation to market conditions
Full Customization Control
Volume Range Settings: Define min/max volume ratios for optimal sensitivity
Transparency Control: Adjust brightness levels from 0-95%
Custom Colors: Choose your preferred bullish/bearish base colors
Moving Average Period: Customize the volume comparison timeframe (default: 30)
Enhanced Visualization
Optional Info Panel: Real-time display of volume metrics
Volume Ratio Plot: Additional pane showing volume ratio trends
Clean Interface: Non-intrusive overlay that enhances price action
How It Works
The indicator calculates relative volume by comparing current volume to a Simple Moving Average (SMA) of volume over your chosen period. This ratio is then mapped to a continuous color scale:
Volume Ratio > 2.0: Maximum intensity (brightest colors)
Volume Ratio 1.0: Average volume (medium intensity)
Volume Ratio < 0.5: Below average (most transparent)
Bullish Candles (Close > Open): Green gradient
Bearish Candles (Close < Open): Red gradient
Trading Applications
Volume Spread Analysis (VSA)
Perfect companion for VSA traders who need to quickly identify:
Climactic volume at key support/resistance levels
No demand situations with low volume
Professional money accumulation/distribution patterns
Breakout Confirmation
High volume breakouts: Immediately visible with bright colors
False breakouts: Revealed by low volume (faded colors)
Volume divergences: Spotted instantly through color intensity changes
Market Structure Analysis
Support/Resistance tests: Volume validation through color brightness
Trend strength: Continuous color feedback on volume participation
Market phases: Easy identification of accumulation vs distribution
Why Choose This Indicator?
Advantages Over Traditional Volume Indicators:
Instant Visual Feedback: No need to look at separate volume bars
Continuous Scale: More precise than discrete level systems
Customizable Sensitivity: Adapt to any market or timeframe
Clean Charts: Maintains focus on price action while adding volume context
Universal Application: Works on all instruments and timeframes
Settings Guide
Essential Settings:
Volume MA Period (30): Longer periods = smoother baseline, shorter = more sensitive
Min Volume Ratio (0.2): Lower values = more sensitivity to low volume
Max Volume Ratio (3.0): Higher values = accommodate extreme volume spikes
Transparency Range (10-85%): Adjust visual contrast to your preference
Pro Tips:
Day Trading: Use 10-20 period MA for quick volume changes
Swing Trading: Use 30-50 period MA for broader volume context
Lower transparency range (0-70%) for subtle effects
Higher transparency range (20-90%) for dramatic contrasts
Best Practices
Combine with Price Action: Use volume colors to confirm price patterns
Multiple Timeframes: Apply on different timeframes for comprehensive analysis
Market Context: Adjust sensitivity based on market volatility periods
Backtesting: Test settings on historical data before live trading
Perfect For:
Volume Spread Analysis practitioners
Breakout traders seeking confirmation
Market structure analysts
Anyone wanting cleaner, more intuitive volume visualization
Technical Specifications
Pine Script v6 - Latest version compatibility
Overlay Indicator - Works directly on price charts
Minimal Performance Impact - Optimized calculations
All Market Types - Stocks, Forex, Crypto, Futures
Transform your volume analysis today! Experience the difference continuous color gradients make in identifying high-probability trading opportunities.
Like and follow for more innovative trading tools!
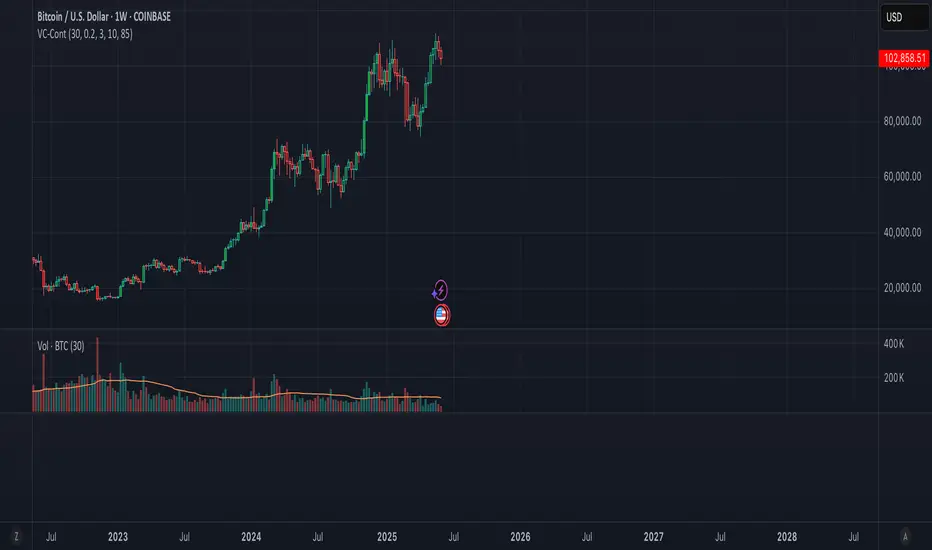
Adaptive Pulsar Momentum | QuantEdgeB⚡ Adaptive Pulsar Momentum | QuantEdgeB
🔭 What is Adaptive Pulsar Momentum?
The Adaptive Pulsar Momentum (APM) is a high-performance, modular trading system designed to decode market momentum across a range of conditions. It combines multi-indicator adaptability (RSI, MFI, Z-Score, ROC, and a hybrid AVG mode) with dynamic signal generation using five advanced "modes" of signal logic: Impulse, Trend, Heikin-Ashi Candles, Statistical Deviation, and MACD.
💡 Think of APM as a scientific instrument, scanning, adapting, and broadcasting precision-tuned momentum data in real-time, helping traders eliminate noise, guesswork, and lag.
___________________________________
1.🔧 System Core: Customizability and Adaptation
📊 Indicator Modes
• 𝓡𝓢𝓘 (Relative Strength Index): Classic oscillator detecting overbought/oversold zones.
• 𝓩-𝓢𝓒𝓞𝓡𝓔: Normalized deviation from mean; ideal for statistical reversion plays.
• 𝓜𝓕𝓘 (Money Flow Index): Volume-weighted RSI-style metric.
• 𝓡𝓞𝓒 (Rate of Change): Measures the velocity of price change.
• 𝓐𝓥𝓖: Combines RSI, MFI, Z-Score, and ROC into a unified signal (normalized to 0–100 scale).
🧠 MA Engine (Smoothing)
Over a dozen moving average types:
• Includes ALMA, TEMA, JMA, SMMA, HMA, LSMA, VWMA, and more.
• Dynamic smoothing makes this system versatile across markets and timeframes.
___________________________________
2.🧨 SIGNAL MODES – THE ENGINE ROOM
Each mode turns the raw smoothed indicator into a powerful momentum signal with thresholds and logic specific to the use case.
1️⃣ 𝓘𝓶𝓹𝓾𝓵𝓼𝓮 Mode
🚀 Use case:
Best for detecting explosive, fast-moving momentum before the crowd catches on.
🔍 Logic:
• Thresholds can be Static, Percentile-based, or Standard Deviation derived.
• Dynamic signal: +1 for breakout, -1 for breakdown, 0 for neutral.
• Custom threshold percentiles enable precise tuning.
🎯 Ideal for:
• Scalping breakouts
• Event-driven spikes (e.g., CPI, FOMC)
• Early trend initiation
2️⃣ 𝓣𝓻𝓮𝓷𝓭 Mode
🧭 Use case:
Built to identify and follow trends with minimal noise. Stable, low-churn logic for riding moves.
🔍 Logic:
• Signal generated via cross above/below a calculated midline (either fixed or dynamic mean).
• Best paired with SMMA or TEMA smoothing.
🎯 Ideal for:
• Swing traders
• Momentum trend followers
• Portfolio rotation strategies
3️⃣ 𝓗𝓐 𝓒𝓪𝓷𝓭𝓵𝓮𝓼 Mode
🔥 Use case:
Filters volatility while capturing structural momentum shifts using Heikin-Ashi logic on smoothed indicators.
🔍 Logic:
• Converts the smoothed signal into Heikin-Ashi candles.
• Measures close vs open to determine trend direction.
• Thresholds again can be static, percentile, or SD-based.
🎯 Ideal for:
• Visual trend clarity
• Avoiding whipsaws in sideways markets
• Discretionary trading with cleaner structure
• Mean-Reverting
4️⃣ 𝓢𝓽𝓪𝓽𝓲𝓼𝓽𝓲𝓬𝓪𝓵 𝓓𝓮𝓿𝓲𝓪𝓽𝓲𝓸𝓷 Mode
🧪 Use case:
Detects high-volatility expansions before or during major directional surges.
🔍 Logic:
• Calculates absolute deviation using HA open vs close.
• Filters this with a moving average and overlays a volatility cloud.
• Breaks above/below the cloud signal directional surge.
🎯 Ideal for:
• Pre-breakout scanning
• Identifying regime shifts
• Options traders looking for volatility expansions
5️⃣ 𝓜𝓐𝓒𝓓 Mode
🧲 Use case:
Classic MACD principles adapted to smoothed momentum indicators—ideal for trend continuation or crossovers.
🔍 Logic:
• MACD line = Pulsar signal - EMA of signal.
• Thresholds (up/down) define bias.
• Optional extra filter to validate with midline crossing.
🎯 Ideal for:
• Trend confirmation
• Crossover-based entry strategies
• Confluence with higher timeframe bias
___________________________________
3.📊 System Sensor Table
Adaptive Pulsar Momentum includes a live multi-layered analytics table designed to give traders a complete pulse on current market behavior. Here's what each section reveals:
🔁 System Signal
At any given bar, the algorithm outputs one of three states:
• Long ⟹ Bullish conditions are active and sustained
• Short ⟹ Bearish momentum dominates
• Cash ⟹ Neutral zone — conditions lack a strong directional bias
This is dynamically adjusted based on the selected signal mode (Impulse, Trend, etc.) and adapts in real time to shifts in smoothed oscillator logic or candle structure.
📊 Strength: Conviction & Potential
Unlike binary signals, this table offers graded insights into how strong or fragile the signal actually is, a huge upgrade from traditional systems.
There are two distinct layers:
1. Conviction Strength –> shown when the system is in a full long or short signal.
- A value like “Long Strength: 84%” means there's high confidence in the continuation or follow-through of the current bias.
- It blends distance from threshold, momentum velocity (Rate of Change), and position in range to avoid false positives and overstretched signals.
2. Potential Strength –> shown during neutral (Cash) periods.
- Two bars appear: one for bullish potential, another for bearish potential.
- These answer: “If the market were to move soon, which side has the edge?”
- Example: "↗ 68% / ↘ 32%" means bulls have more pent-up energy or structure.
These bars provide pre-signal tension, helping traders anticipate breakouts or avoid traps during choppy periods.
🔸 HA Candle Phase (When Mode = HA Candles)
Instead of showing strength bars, this mode displays a phase label, interpreting the Heikin-Ashi candle structure in context of momentum and thresholds:
- Momentum Up / Down –> Strong impulse direction confirmed above or below dynamic bounds.
- Reversal Up / Down –> Early signs of potential reversals (price beyond bounds but opposite signal ).
- Continuation Up / Down –> Sustained movement after a signal confirmation (post-threshold cross).
- Chop –> Sideways indecisiveness, often signaling to reduce risk or await clarity.
- Neutral –> No active momentum or pattern signal.
This provides a narrative view of market behavior, ideal for discretionary traders who rely on visual rhythm and pattern recognition.
___________________________________
5. 🧠 Optional Smart Configuration
Enable “Use Recommended Settings” to auto-configure:
• Optimized lengths
• Best-suited moving averages
• Signal type filters
• Volatility lookbacks
Perfect for those wanting precision without manual tuning.
___________________________________
6.🧪 Use Cases by Mode Summary
🔹 Impulse Mode
Ideal for traders looking to capitalize on sharp breakouts or high-momentum reversals. This mode is built for speed and sensitivity, making it a go-to for scalping, reacting to news events, or identifying trends at their earliest inflection points.
🔹 Trend Mode
Engineered for longer-term positioning, this mode tracks sustained directional bias over time. Best suited for swing traders or those managing portfolio allocations, it's focused on the midline dynamics that define trend health and commitment.
🔹 HA Candles Mode
This mode filters out noise through smoothed Heikin-Ashi transformations, providing clean visual structure. It's perfect for discretionary traders, pattern recognizers, or those looking to enter pullbacks within broader trends. The phase system (e.g. Momentum, Reversal, Chop) adds narrative context to price action.
🔹 Statistical Deviation Mode
A quantitative engine for traders who thrive on volatility exploitation. By modeling deviations from mean behavior, it's particularly powerful in options strategies, regime detection, or scanning for expansion conditions. This mode excels when price breaks away from standard norms.
🔹 MACD Mode
The classic concept of momentum meets modern smoothing in this variant. Use this for confirmation, spotting divergences, or executing crossover-based strategies. MACD mode gives clarity in ambiguous zones, favoring structured continuation or reversal bias.
Each mode is uniquely crafted for a different style of trader and market environment, and switching between them transforms the entire engine’s behavior
___________________________________
🧭 Conclusion
Adaptive Pulsar Momentum isn’t just a signal tool, it’s a market intelligence system. Whether you’re scalping volatility, swinging trends, or navigating uncertain chop, APM dynamically adjusts to the rhythm of the market. With precision-tuned signal modes, a smart strength matrix, and plug-and-play configuration, it transforms raw momentum into actionable clarity.
📌 Trade with Statistical Precision | Powered by QuantEdgeB
🔹 Disclaimer: Past performance is not indicative of future results.
🔹 Strategic Advice: Always backtest, optimize, and align parameters with your trading objectives and risk tolerance before live trading.

Intraday Pivot Highs & Lows (Asia London NY)Intraday Pivot Highs & Lows (Asia London NY)
Script Description
This TradingView indicator is optimized for Forex, scalping, intraday, and day trading strategies. It accurately plots Pivot Points and levels, high/low, support and resistance levels. These are clearly identified to aid the trader during killzone sessions and session opens. Ideal for scalp trading, intraday sessions, and leveraging SMT (Smart Money Techniques). Utilize these Price Levels effectively during London Open, NY Open, and the Asia Session, utilizing Market Structure to pinpoint key levels and reversal zones for successful trading. Improve your Trade Setups, recognize reliable Chart Patterns, identify critical Price Pivots, and trade confidently off Institutional Levels.
This script marks the intraday pivot highs, lows and midpoints retracement levels for
Asia
London
New York
It also plots the previous day's high, low, midpoint, and 0.618 Fibonacci retracement levels, providing traders with critical price reference points for making intraday trading decisions.
Originality & Usefulness
This indicator uniquely integrates pivot calculations across three major Forex sessions (Asia, London, NY), clearly delineating session boundaries.
It enhances visibility by using distinct styling
solid for New York
dashed for London
dotted lines for Asia
And colour co-ordinated labeling, improving traders' ability to identify important intraday price action zones efficiently. Unlike standard pivot indicators, this script emphasizes session-specific trading dynamics.
### Key Features ###
Session-Based Levels: Automatically plots high, low, midpoint, and Fibonacci (.618) levels for each major session (Asia, London, NY).
Distinct Visual Cues: Lines and labels use session-specific styles and colors to easily differentiate between sessions.
Previous Day Reference: Clearly plots and labels yesterday's high, low, midpoint, and Fibonacci levels.
Flexible Visibility: Traders can set timeframe visibility to maintain clean charts on higher timeframes.
### How It Works
At the start of next day's session, previous session lines are cleared, ensuring the chart remains uncluttered.
High, low, midpoint, and Fibonacci retracement levels (.618) are dynamically calculated and displayed at the close of each session.
All session levels remain visible until the start of the next respective session, providing continuous actionable insights.
Trading Application:
Session highs and lows act as strong intraday support and resistance zones.
Midpoints and Fibonacci levels are effective for identifying potential reversal zones and retracements.
Daily levels provide a broader context, useful for gauging intraday volatility and range.
### Limitations and Considerations ##
Best used on liquid assets with clear session-based price action, such as Forex major pairs, if used on indexes make sure they contain 24 hour price action not just New York session.
This indicator is designed to streamline intraday trading by clearly marking essential pivot points and session-based levels, significantly improving traders' market context and decision-making accuracy. Can be used to enhance SMT decision making when scalping killzones.
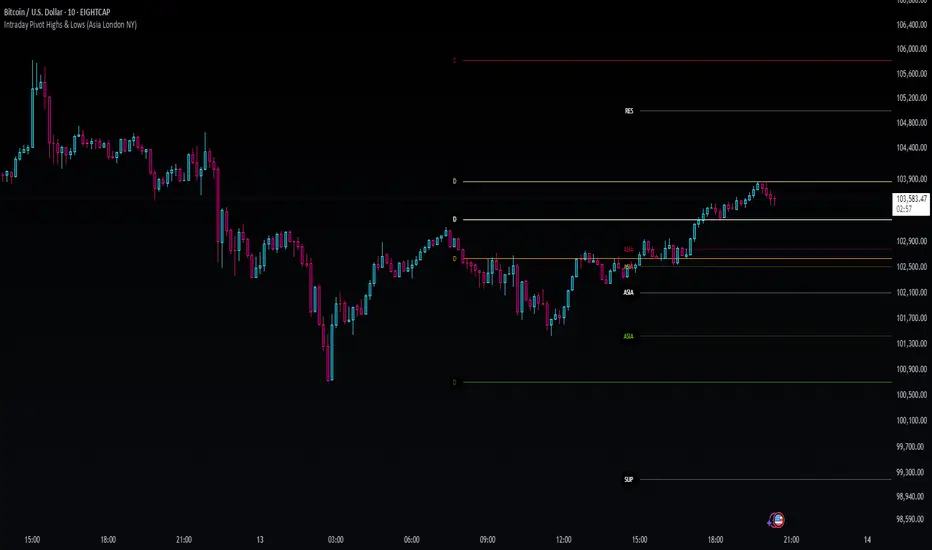
ZenAlgo - AvengerThe ZenAlgo - Avenger indicator provides a multi-layered view of market behavior by combining volume delta analytics, trend-following EMAs, average price comparison, and price-volume profiling into a unified overlay. It is designed to visually assist traders in identifying areas of interest, momentum shifts, and potential reversals using cumulative data from both spot and perpetual markets.
Volume Delta Calculation
This indicator computes delta as the difference between estimated buy and sell volumes using volume data from multiple centralized exchanges. It distinguishes between spot and perpetual volumes, combining them into total volume.
To estimate buying and selling volume from raw volume data, candle structure is broken down into body and wicks. The body is interpreted as the core directional movement (buy/sell), while the wicks are treated as uncertain or counteraction. This segmentation helps infer the likely share of buying and selling within each bar.
The delta is calculated per bar and then aggregated over a lookback period (default 14 bars) to generate a cumulative delta. This approach provides a smoothed value of volume pressure trends over time.
A moving average is applied to the delta values (using selectable MA types like EMA or SMA) to define signal crossovers and suppress noise.
Delta Visualization
To contextualize delta within price action, the delta is scaled dynamically (by ATR or user-defined value) and plotted as a band around the closing price. Positive delta expands upward from price, negative delta downward. This provides a visual overlay that reflects net market pressure in context with price movement.
In cases of extreme delta (threshold set at 80% of recent maximum), the indicator marks spike bars using symbols to indicate significant directional pressure.
Identification of Noteworthy Conditions
The indicator highlights points on the chart where specific conditions are met based on the interaction between volume delta and its moving average. These conditions may align with moments of market pressure imbalance and directional movement, but they are not to be interpreted as trade signals in isolation.
Instead, these chart markers serve as visual flags for potential interest. They are intended to draw the user’s attention to scenarios where:
The delta crosses above or below its moving average, suggesting a potential shift in volume pressure.
The cumulative delta supports the direction of this crossover.
Optional filters can further restrict these markings to periods where:
The short-term trend (as inferred from EMA slope) supports the direction.
Volume is elevated relative to a recent average.
A user-defined cooldown period prevents multiple markings within short succession to avoid clutter.
It is essential to underscore that these markers do not constitute buy or sell advice . Their role is diagnostic , helping the trader to identify potential moments of interest which should be analyzed in conjunction with broader context, such as trend structure, price action, support/resistance levels, or external market data.
EMA Structure
Six EMAs with fixed lengths (13 to 56) are plotted and colored dynamically based on the most recent crossover between the fastest and slowest (EMA1 and EMA6). These EMAs help visualize short- to mid-term trends. The crossover itself is marked with symbols, with vertical offset based on ATR to maintain chart readability.
Average Line (AVG)
The indicator also calculates an average price based on a fixed window (100 bars). This is not a standard moving average but rather a raw average of recent prices stored in a circular buffer. The average is plotted, and its relative distance to the current price is labeled as a percentage. This feature serves as a simplified representation of fair value or mean reversion anchor.
EMA6 vs AVG Cross
Another layer of point of interest detection involves EMA6 crossing the AVG line. This crossover is only considered valid if EMA6 shows slope consistency in the crossing direction. These events are marked using symbols and offset vertically to avoid overlapping price action.
Divergence Detection
The script detects both regular and hidden divergences between price and delta:
Regular divergences are defined when price makes a higher high or lower low, while delta fails to confirm (makes a lower high or higher low).
Hidden divergences occur when price retraces (lower high or higher low), but delta moves against this retracement, indicating underlying strength or weakness.
Divergence points are labeled with "R" (regular) or "H" (hidden) and appear at local pivot highs or lows. The number of visible divergence labels can be limited for chart clarity.
POC and nPOC Calculations
The script includes a simplified volume profile implementation, calculating:
POC (Point of Control): the price level with the highest volume for the given period.
nPOC (non-tested POC): historical POCs that have not yet been revisited by price.
Price levels are bucketed into rows (user-defined), and volume per bucket is tracked to identify the POC. Upon a new period (e.g., day, week), a horizontal POC line is drawn. Once tested by price, the line’s appearance changes (color fades, label shrinks), helping users distinguish between untouched and touched levels.
Limits are enforced on the number of retained POCs and their maximum distance from current bars to optimize performance and chart readability.
Exchange Aggregation
Volume data is aggregated across major exchanges. This ensures that the delta calculation captures a broader market picture beyond a single venue, reducing exchange-specific noise.
How to Interpret Values
Delta Band: Wide bands indicate strong directional imbalance. Narrow bands suggest indecision or low volume.
EMA Crossover Symbols: Appear on directional shifts in moving averages. Multiple EMAs reinforcing the same slope typically indicate stronger trend.
AVG Line: Represents average price over recent history. Large deviations can indicate overextension or potential mean reversion.
Divergences: Regular ones may point to weakening momentum; hidden ones can suggest continuation despite corrective price action.
POC / nPOC: Key volume-based support/resistance levels. Untested nPOCs can act as magnets for price retests.
How to Best Use This Indicator
Use in conjunction with trend context (e.g., higher timeframe EMAs) to avoid counter-trend indications.
Treat delta spikes as caution zones—especially if they occur at known support/resistance.
Watch for divergences as early warning signs before price reverses.
Use POC/nPOC as target levels, especially if aligned with delta signals.
Apply volume and trend filters to reduce noise on shorter timeframes.
Added Value
Multi-exchange volume aggregation makes the delta calculation more robust.
Real-time cumulative delta overlaid directly on the price chart provides immediate context.
Points of interest on chart are conservative and filterable, intended to reduce false positives.
The combination of delta, trend-following EMAs, fair value line, and volume profile data is rarely found in one overlay script.
POC/nPOC visualization based on real traded volume helps identify high-interest zones for future price interaction.
Why Is It Worth Paying For
While free alternatives may provide partial insights (e.g., basic delta or single EMA crossovers), this indicator integrates multiple domains—delta, divergence, average price, trend overlays, and profile levels—into a coherent, optimized chart tool. The value lies not just in having these tools, but in how they are synchronized and visualized.
Furthermore, sourcing and synchronizing volume data from multiple exchanges for delta estimation is not straightforward in Pine Script and adds to the indicator's complexity and utility.
Disclaimers and Limitations
Delta estimation is based on candle structure and assumes wick/body distribution reflects buyer/seller activity, which may not always be precise.
Multi-exchange volume data relies on availability via TradingView’s request.security() function; if exchange data is missing or delayed, results may be incomplete.
Divergences do not guarantee reversals—should be used as part of a broader analysis framework.
On illiquid instruments or exotic pairs, the value of delta and volume-based analytics may be reduced due to unreliable volume.

[Pandora's Chambers] BUY/SELL Blocks + Strength FCBased on the secret technique of ATTA,
Traditional price action analysis techniques, such as ICT (Inner Circle Trader), are often based on subjective interpretations and frequently miss the true structure of the market according to the Wyckoff method. The " BUY/SELL Blocks + Strength FC" indicator aims to correct this problem by automatically and accurately identifying buy/sell "blocks" according to Wyckoff principles, calculating volume strength, filtering breached blocks, and displaying precise support and resistance levels.
Indicator Highlights
Buy/Sell Blocks Identification
Uses the ta.pivothigh and ta.pivotlow functions to locate upper and lower pivot points, and draws a "box" between the two points to represent the block.
Each block is automatically extended to the right of the chart (can be disabled in settings) for a fixed number of bars or until the end of the chart.
Colors are configurable: turquoise shades for buy blocks, and purple for sell blocks.
Volume Strength Calculation and Update
In each candle, positive volume (in a rising market) or negative volume (in a falling market) is added to the relevant block.
Displays in percentages which side (buyers/sellers) controls the block: a label on the block shows +XX% or -XX%.
Changes the background color of the box to gray when the net volume flips (e.g., a strong sell block receives a net positive).
Filtering Breached Blocks
Option to automatically filter and remove blocks where the price has closed above the top of the sell block or below the bottom of the buy block, in order to maintain a clean and focused chart.
"Adjusted" Fibonacci Grid
In the last calculated bars, the indicator identifies the nearest high support level (sup) and the nearest low resistance level (res) among all existing blocks.
Based on sup and res, a Fibonacci grid of 0%, 25%, 50%, 75%, and 100% is constructed, automatically updating as the chart progresses.
What is so new here?
Accuracy according to Wyckoff and not personal interpretation: In the Wyckoff method, market oscillations are built on supply and demand balances in precise price gaps. Here, each block is built directly on pivots from a number of bars back, and not on feelings of an "area" as is sometimes done in ICT techniques.
Quantitative measurement of control: The indicator does not settle for a visual identification of a block but calculates for each block the buy volume versus the sell volume, and clearly displays who is in control.
Automatic filtering to maintain relevance: Breached blocks are removed, so only the strong areas that have not yet been closed remain.
Full integration with modern price action: Understanding price movement is measured here objectively, leaving no room for subjective interpretations of "structure breaks" or "diagonal waves" that standard tools do not support.
Why is the existing price action not enough?
Inconsistency in defining supply and demand zones: Many techniques rely on manual marking of "buy zones" only, without fixed criteria (number of bars back, low highs, volume, etc.).
Scarcity of quantitative indicators: Without calculating net volume, it is difficult to know if a particular block is truly supported by the power of buyers or sellers.
Net invalidation of blocks that have been violated: Repeated breaches of support and resistance areas below/above their boundaries confuse the trader, while here they are automatically removed.
The " BUY/SELL Blocks + Strength FC" indicator comes to correct all these shortcomings, and provides the user with an objective, accurate, and quantitative framework for understanding the dynamics of the market and identifying volume-based support and resistance areas, according to the principles of the Wyckoff method.
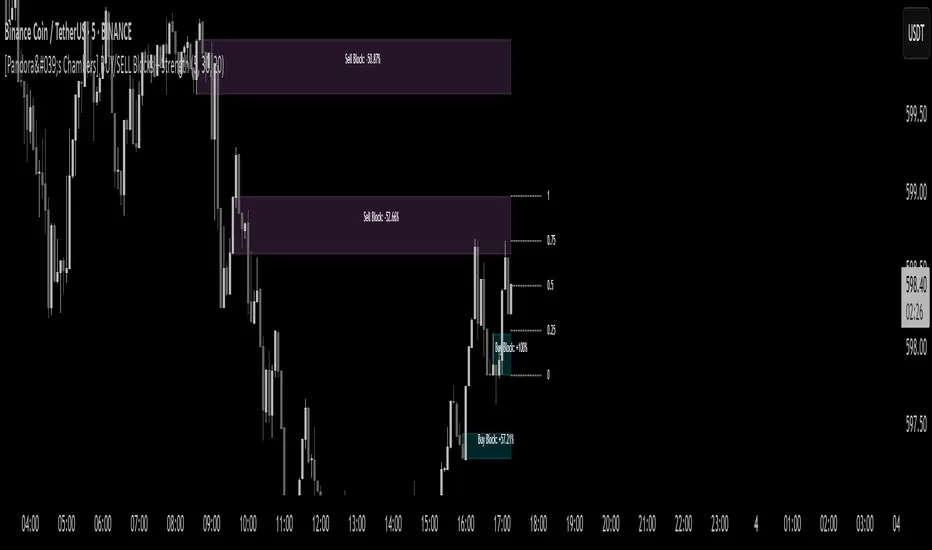
Adaptive Freedom Machine w/labelsAdaptive Freedom Machine w/ Labels
Overview
The Adaptive Freedom Machine w/ Labels is a versatile Pine Script indicator designed to assist traders in identifying buy and sell opportunities across various market conditions (trending, ranging, or volatile). It combines Exponential Moving Averages (EMAs), Relative Strength Index (RSI), Average True Range (ATR), and customizable time filters to generate actionable signals. The indicator overlays on the price chart, displaying EMAs, a dynamic cloud, scaled RSI levels, buy/sell signals, and market condition labels, making it suitable for swing trading, day trading, or scalping.
What It Does
This indicator generates buy and sell signals based on the interaction of two EMAs, filtered by RSI thresholds, ATR-based volatility, and user-defined time windows. It adapts to the selected market condition by adjusting EMA lengths, RSI thresholds, and trading hours. A dynamic cloud highlights trend direction or neutral zones, and candlestick bodies are colored in neutral conditions for clarity. A table displays real-time trend and volatility status.
How It Works
The indicator uses the following components:
EMAs: Two EMAs (short and long) are calculated on a user-selected timeframe (1, 5, 15, 30, or 60 minutes). Their crossover or crossunder generates potential buy/sell signals, with lengths adjusted based on the market condition (e.g., longer EMAs for trending markets, shorter for ranging).
Dynamic Cloud: The area between the EMAs forms a cloud, colored green for uptrends, red for downtrends, or a user-defined color (default yellow) for neutral zones (when EMAs are close, determined by an ATR-based threshold). Users can widen the cloud for visibility.
RSI Filter: RSI is scaled to price levels and plotted on the chart (optional). Signals are filtered to ensure RSI is within user-defined buy/sell thresholds and not in overbought/oversold zones, with thresholds tailored to the market condition.
ATR Volatility Filter: An optional filter ensures signals occur during sufficient volatility (ATR(14) > SMA(ATR, 20)).
Time Filter: Signals are restricted to a user-defined or market-specific time window (e.g., 10:00–15:00 UTC for volatile markets), with an option for custom hours.
Visual Aids: Buy/sell signals appear as green triangles (buy) or red triangles (sell). Candlesticks in neutral zones are colored (default yellow). A table in the top-right corner shows the current trend (Uptrend, Downtrend, Neutral) and volatility (High or Low).
The indicator ensures compatibility with standard chart types (e.g., candlestick charts) to produce realistic signals, avoiding non-standard types like Heikin Ashi or Renko.
How to Use It
Add to Chart: Apply the indicator to a candlestick or bar chart on TradingView.
Configure Settings:
Timeframe: Choose a timeframe (1, 5, 15, 30, or 60 minutes) to align with your trading style.
Market Condition: Select one market condition (Trending, Ranging, or Volatile). Volatile is the default if none is selected. Only one condition can be active.
Filters:
Enable/disable the ATR volatility filter to trade only in high-volatility periods.
Enable the time filter and choose default hours (specific to the market condition) or set custom UTC hours.
Cloud Settings: Adjust the cloud width, neutral zone threshold, and color. Enable/disable the neutral cloud.
RSI Display: Toggle the scaled RSI and its thresholds on the chart.
Interpret Signals:
Buy Signal: A green triangle below the bar indicates a potential long entry (EMA crossover, RSI above buy threshold, within time window, and passing volatility filter).
Sell Signal: A red triangle above the bar indicates a potential short entry (EMA crossunder, RSI below sell threshold, within time window, and passing volatility filter).
Neutral Zone: Yellow candlesticks and cloud (if enabled) suggest a lack of clear trend; avoid trading or use for range-bound strategies.
Monitor the Table: Check the top-right table for real-time trend (Uptrend, Downtrend, Neutral) and volatility (High or Low) to confirm market context.
Unique Features
Adaptive Parameters: Automatically adjusts EMA lengths, RSI thresholds, and trading hours based on the selected market condition, reducing manual tweaking.
Neutral Zone Detection: Uses an ATR-based threshold to identify low-trend periods, helping traders avoid choppy markets.
Scaled RSI Visualization: Plots RSI and thresholds directly on the price chart, making it easier to assess momentum relative to price action.
Flexible Time Filtering: Supports both default and custom UTC-based trading windows, ideal for day traders targeting specific sessions.
Dynamic Cloud: Enhances trend visualization with customizable width and neutral zone coloring, improving readability.
Notes
Use on standard candlestick or bar charts to ensure realistic signals.
Test the indicator on a demo account to understand its behavior in your chosen market and timeframe.
Adjust settings to match your trading strategy, but avoid over-optimizing for past data.
The indicator is not a standalone system; combine it with other analysis (e.g., support/resistance, news events) for better results.
Limitations
Signals may lag in fast-moving markets due to EMA-based calculations.
Neutral zone detection may vary in extremely volatile or illiquid markets.
Time filters are UTC-based; ensure your platform’s timezone settings align.
This indicator is designed for traders seeking a customizable, trend-following tool that adapts to different market environments while providing clear visual cues and robust filtering.

Volume Signal RSIVolume Signal RSI (VSR) Indicator
Overview:
The Volume Signal RSI (VSR) indicator combines traditional RSI analysis with statistically significant volume detection to identify potential reversal points and exhaustion signals in crypto markets. By applying statistical methods to volume analysis, VSR filters out normal market noise and highlights only the most meaningful volume spikes.
Key Features:
- Standard RSI overbought/oversold signals (70/30)
- Statistical volume significance detection using z-scores and p-values
- Exhaustion signals for potential market reversals
- Enhanced alert system with actionable trading context
How to Use This Indicator
Basic Signals:
- RSI Line: The blue line shows the standard RSI value (default period: 14)
- Overbought/Oversold Levels: Standard levels at 70/30 with additional extreme levels at 80/20
- Volume Detection: Small circles appear on the RSI line when statistically significant volume is detected
Trading Signals
1. Oversold Alert (🔴): When RSI crosses below 30
- Indicates potential support area
- Consider for long entries when price shows signs of stabilizing
2. Overbought Alert (🟢): When RSI crosses above 70
- Indicates potential resistance area
- Consider for short entries when price shows signs of topping
3. Bear Exhaustion Signal (⚠️): When bearish volume appears in oversold territory
- Indicates a potential selling climax
- Strong reversal signal when accompanied by positive price action
- Best used for counter-trend entries during downtrends
4. Bull Exhaustion Signal (⚠️): When bullish volume appears in overbought territory
- Indicates a potential buying climax
- Strong reversal signal when accompanied by negative price action
- Best used for counter-trend entries during uptrends
Alert Messages:
Alert messages contain critical information formatted for quick analysis:
- Symbol and timeframe
- Current price and RSI value with direction indicator
- Volume metrics: z-score, deviation percentage, and statistical confidence
- Trading context suggestion
Statistical Methodology:
- Z-Score: Measures how many standard deviations the current volume is from the mean
- P-Value: Statistical measure of significance (lower values = more significant)
- Confidence: Displayed as a percentage (higher = more confidence in the signal)
- Volume Deviation: Percentage above/below the average volume
Best Practices
1. Confirm signals with price action or other indicators
2. Higher timeframes typically produce more reliable signals
3. Use the statistical confidence percentage to gauge signal strength
4. Most powerful signals occur when exhaustion signals coincide with key support/resistance levels and there a quarter or more wick size at top of candle(buying exhaustion) or at bottom of candle (selling exhaustion)

SMT SwiftEdge PowerhouseSMT SwiftEdge Powerhouse: Precision Trading with Divergence, Liquidity Grabs, and OTE Zones
The SMT SwiftEdge Powerhouse is a powerful trading tool designed to help traders identify high-probability entry points during the most active market sessions—London and New York. By combining Smart Money Technique (SMT) Divergence, Liquidity Grabs, and Optimal Trade Entry (OTE) Zones, this script provides a unique and cohesive strategy for capturing market reversals with precision. Whether you're a scalper or a swing trader, this indicator offers clear visual signals to enhance your trading decisions on any timeframe.
What Does This Script Do?
This script integrates three key concepts to identify potential trading opportunities:
SMT Divergence:
SMT Divergence compares the price action of two correlated assets (e.g., Nasdaq and S&P 500 futures) to detect hidden market reversals. When one asset makes a higher high while the other makes a lower high (bearish divergence), or one makes a lower low while the other makes a higher low (bullish divergence), it signals a potential reversal. This technique leverages institutional "smart money" behavior to anticipate market shifts.
Liquidity Grabs:
Liquidity Grabs occur when price breaks above recent highs or below recent lows on higher timeframes (5m and 15m), often triggering stop-loss orders from retail traders. These breakouts are identified using pivot points and confirm institutional activity, setting the stage for a reversal. The script focuses on liquidity grabs during the London and New York sessions for maximum market activity.
Optimal Trade Entry (OTE) Zones:
OTE Zones are Fibonacci-based retracement areas (e.g., 61.8%) calculated after a liquidity grab. These zones highlight where price is likely to retrace before continuing in the direction of the reversal, offering a high-probability entry point. The script adjusts the width of these zones using the Average True Range (ATR) to adapt to market volatility.
By combining these components, the script identifies when institutional activity (liquidity grabs) aligns with market reversals (SMT divergence) and pinpoints precise entry points (OTE zones) during high-liquidity sessions.
Why Combine These Components?
The integration of SMT Divergence, Liquidity Grabs, and OTE Zones creates a robust trading system for several reasons:
Synergy of Institutional Signals: SMT Divergence and Liquidity Grabs both reflect "smart money" behavior—divergence shows hidden reversals, while liquidity grabs confirm institutional intent to trap retail traders. Together, they provide a strong foundation for identifying high-probability setups.
Session-Based Precision: Focusing on the London and New York sessions ensures signals occur during periods of high volatility and liquidity, increasing their reliability.
Precision Entries with OTE: After confirming a setup with divergence and liquidity grabs, OTE zones provide a clear entry area, reducing guesswork and improving trade accuracy.
Adaptability: The script works on any timeframe, with adjustable settings for signal sensitivity, session times, and Fibonacci levels, making it versatile for different trading styles.
This combination makes the script unique by aligning institutional insights with actionable entry points, tailored to the most active market hours.
How to Use the Script
Setup:
Add the script to your chart (works on any timeframe, e.g., 1m, 5m, 15m).
Configure the settings in the indicator's inputs:
Session Settings: Adjust the start/end times for London and New York sessions (default: London 8-11 UTC, New York 13-16 UTC). You can disable session restrictions if desired.
Asset Settings: Set the primary and secondary assets for SMT Divergence (default: NQ1! and ES1!). Ensure the assets are correlated.
Signal Settings: Adjust the lookback period, ATR period, and signal sensitivity (Low/Medium/High) to control the frequency of signals.
OTE Settings: Choose the Fibonacci level for OTE zones (default: 61.8%).
Visual Settings: Enable/disable OTE zones, SMT labels, and debug labels for troubleshooting.
Interpreting Signals:
Blue Circles: Indicate a liquidity grab (price breaking a 5m or 15m pivot high/low), marking the start of a potential setup.
Blue OTE Zones: Appear after a liquidity grab, showing the retracement area (e.g., 61.8% Fibonacci level) where price is likely to enter for a reversal trade. The label "OTE Trigger 5m/15m" confirms the direction (Short/Long) and session.
Green/Red Entry Boxes: Mark precise entry points when price enters the OTE zone and confirms the SMT Divergence. Green boxes indicate a long entry, red boxes a short entry.
Trading Example:
On a 1m chart, a blue circle appears when price breaks a 5m pivot high during the London session.
A blue OTE zone forms, showing a retracement area (e.g., 61.8% Fibonacci level) with the label "OTE Trigger 5m/15m (Short, London)".
Price retraces into the OTE zone, and a red "Short Entry" box appears, confirming a bearish SMT Divergence.
Enter a short trade at the red box, with a stop-loss above the OTE zone and a take-profit at the next support level.
Originality and Utility
The SMT SwiftEdge Powerhouse stands out by merging SMT Divergence, Liquidity Grabs, and OTE Zones into a single, session-focused indicator. Unlike traditional indicators that focus on one aspect of price action, this script combines institutional reversal signals with precise entry zones, tailored to the most active market hours. Its adaptability across timeframes, customizable settings, and clear visual cues make it a versatile tool for traders seeking to capitalize on smart money movements with confidence.
Tips for Best Results
Use on correlated assets like NQ1! (Nasdaq futures) and ES1! (S&P 500 futures) for accurate SMT Divergence.
Test on lower timeframes (1m, 5m) for scalping or higher timeframes (15m, 1H) for swing trading.
Adjust the "Signal Sensitivity" to "High" for more signals or "Low" for fewer, high-quality setups.
Enable "Show Debug Labels" if signals are not appearing as expected, to troubleshoot pivot points and liquidity grabs.

JOYZONE.04JOYZONE signal for TradingView
The JOYZONE Breakout Indicator is a sophisticated tool designed for traders seeking to identify potential trend reversals and breakouts in financial markets. Built for TradingView’s Pine Script v6, this indicator leverages pivot points to detect significant price levels, offering a clear visual representation of bullish and bearish market shifts. By focusing on key price action patterns, it aims to provide traders with actionable insights for both trend-following and reversal strategies.
Core Functionality
The JOYZONE Breakout Indicator identifies critical pivot highs and lows using a fixed 5-period lookback, which simplifies the detection of potential reversal zones without requiring user adjustments. These pivot points are used to establish "JOYZONE" levels—price thresholds that, when broken with confirmation, signal a change in market trend. The indicator employs a robust confirmation mechanism within fixed bar window, reducing false signals and enhancing reliability.
Upon detecting a breakout, the indicator plots horizontal lines at the JOYZONE levels, extending until a new signal emerges or the trend shifts. Labels accompany these lines, marking bullish (+JOYZONE) and bearish (-JOYZONE) breakouts with customizable colors (default: green for bullish, red for bearish) and sizes (tiny to large). This visual clarity helps traders quickly assess market direction and key price levels.
Key Features
Simplified Inputs: The indicator minimizes user configuration by hardcoding critical parameters like the fixed-period directional detection system. Traders can toggle JOYZONE level visibility, adjust label sizes, and customize colors, ensuring flexibility without overwhelming complexity.
Efficient Signal Management: With a default cap of 86 signals, the indicator prevents chart clutter by automatically removing older lines and labels when the limit is exceeded. This feature is particularly useful for long-term chart analysis.
Dynamic Alerts: The script includes alert triggers for bullish and bearish JOYZONE breakouts, delivering real-time notifications with price details. This enables traders to act swiftly on confirmed signals, whether trading manually or integrating with automated systems.
ATR-Based Label Positioning: Labels are offset using the 50-period Average True Range (ATR), ensuring they remain visible and uncluttered regardless of market volatility.
How It Works
The indicator tracks pivot highs and lows to establish JOYZONE levels during uptrends (bearish levels) and downtrends (bullish levels). When the price crosses a JOYZONE level and satisfies the confirmation criteria, the trend updates, and a breakout signal is plotted. For example, a bullish JOYZONE breakout occurs when the price crosses above a pivot high during a downtrend, confirmed by a close above the threshold. The script then draws a green line and a “+JOYZONE” label, alerting the trader to a potential uptrend.
Use Cases
This indicator is versatile, catering to various trading styles:
Swing Traders: Use JOYZONE breakouts to enter trades at the onset of new trends, with clear entry and stop-loss levels based on plotted lines.
Day Traders: Leverage real-time alerts to capitalize on intraday reversals in volatile markets.
Position Traders: Monitor higher timeframes to identify long-term trend shifts with high-probability setups.
Customization and Performance
Traders can adjust the visibility of JOYZONE levels, label sizes, and colors to suit their chart preferences. The hardcoded 5-period lookback and 0.015% confirmation ensure consistency across assets, but users may need to test performance on specific markets (e.g., forex, stocks, crypto) to align with their strategies. The indicator’s reliance on ATR for label placement adapts to varying volatility, making it effective across different instruments.
Limitations and Considerations
While the JOYZONE Breakout Indicator excels in trending markets, it may produce delayed signals in choppy or sideways conditions due to its confirmation mechanism. Traders should combine it with other tools, such as moving averages or volume indicators, to filter signals. Additionally, the fixed period may not suit all timeframes, so testing on historical data is recommended.
Conclusion
The JOYZONE Breakout Indicator offers a streamlined, visually intuitive approach to detecting trend reversals and breakouts. Its automated signal management, dynamic alerts, and customizable display make it a valuable addition to any trader’s toolkit. By focusing on confirmed price action, it empowers traders to make informed decisions with confidence. Whether you’re a novice or seasoned trader, this indicator provides a reliable framework for navigating dynamic markets.
Disclaimer: This code does not guarantee of profit/return, please analyze with other factors, it is shared only for knowledge and educational purpose.

Teddy LiteOverview
"Teddy" overlays key price levels—Daily Open (DO), Average Daily Range (ADR), and ADR Extensions (ADE)—on intraday charts. Designed for traders, it provides a clear framework to align with market ranges, avoid choppy price action, and stay out of overbought/oversold conditions, enhancing decision-making in dynamic markets.
Originality and Usefulness
"Teddy" uniquely combines DO, ADR High/Low, and ADE High/Low with dynamic percentage labels, while offering a concise view of price boundaries for daily Highs and Lows.
What It Does
Plots DO, ADR High/Low, and ADE High/Low as levels on the chart.
Labels each level with percentage distances from the current price (e.g., "ADRH (2.34%)").
Customizes visuals for clarity (colors, line styles, label sizes).
How It Works
Data Sources: Retrieves daily open and historical high/low data to compute ranges.
Calculations:
Daily Open (DO): Marks the session’s opening price.
ADR: Estimates typical daily range from past data, centered on DO to set High/Low bounds.
ADE: Extends ADR by a fixed percentage for outer limits.
Visualization: Updates lines and labels live, with user-defined colors, styles, and sizes.
How It Helps Traders
"Teddy" guides traders to avoid chasing markets in extended conditions:
Respecting the range: ADR High/Low define range-friendly zones—price above DO nearing ADR High signals bullish momentum is peaking, while below DO near ADR Low supports bearish momentum peaking.
Avoiding Choppy Conditions: Price lingering near DO often indicates indecision; "Teddy" highlights this level, helping you define balanced market conditions that favor choppy conditions.
Steering Clear of Overbought/Oversold: ADE High/Low mark extended levels where reversals are extremely—price hitting ADE Highlights the trend strength on the day but warns price is extremely over extended.
This structured approach keeps trades aligned with the markets average range, so traders can avoid extremes favorable levels for choppiness.
How to Use It
Apply to an intraday chart (e.g., SPY 5m).
Customize via inputs:
"Appearance Settings": Colors, line styles (Solid, Dotted, Dashed), widths (1-6), label visibility, and sizes (Tiny to Huge).
Watch levels: Consider reducing risk as the market approaches our ADRH/L levels. Trades can also play breakouts/failed breakouts at ADR High/Low or at ADE High/Low. Additionally remaining patient while the auction remains in balance near Day Open is an option as well.
Underlying Concepts
Range Dynamics: ADR reflects average daily volatility, DO anchors context, and ADE flags extensions.
Price Action: Levels highlight Volatility/Range (ADR) versus consolidation (DO) or expansive exhaustion (ADE).
Limitations
Optimized for day traders during live sessions; less effective in low-volatility periods.
Requires sufficient historical data for accurate ADR/ADE.
Levels are contextual and where I expect reactive price action to occur.. They are not guaranteed signals.

Volume NodesVolume Nodes Indicator:
What This Indicator Does:
The Volume Nodes indicator identifies and visualizes statistically significant volume events on your chart, helping you identify important price levels where substantial trading activity has occurred. Unlike standard volume indicators, Volume Nodes:
Uses statistical analysis (z-scores) to identify truly abnormal volume bars
Calculates accurate buy/sell volume ratios by analyzing all lower timeframe data
Identifies the Volume Point of Control (VPOC) for high volume areas
Visualizes significant volume ranges as they extend across the chart
Tracks when price interacts with these important levels
Key Features:
High Volume Detection: Highlights bars with unusually high volume (z-score above threshold)
Low Volume Detection: Highlights bars with unusually low volume (z-score below threshold)
VPOC Lines: Horizontal lines showing the exact price level with maximum volume concentration
Volume Range Fills: Shaded areas showing the entire price range with significant volume
Accurate Volume Metrics: Shows true buy/sell volume ratios or delta percentages derived from lower timeframe data
How to Use It in Your Trading: **Move to front in the visual order on chart**
Step 1: Identify Important Volume Zones
High Volume Bars (green/red candles) indicate where significant buying or selling has occurred
VPOC Lines extending from these bars show you the exact price level with highest volume
Range Fills show you the entire zone where significant volume occurred
Step 2: Use These Levels for Trading Decisions
Support/Resistance: VPOC lines often act as support or resistance levels
Breakout Validation: Breakouts on high volume are more likely to be valid
Low Volume Warning: Low volume bars (yellow) often indicate indecision or potential reversals
Trading with Volume Flow: Use the buy/sell ratio or delta % to confirm the strength and direction of moves
Step 3: Monitor Price Interaction with Volume Zones
When price approaches a VPOC line, watch for reaction (bounce or breakout)
When price enters a volume range area, increased volatility often follows
When price crosses a VPOC line, the line changes transparency indicating it's been tested
Tips for Optimal Use
Higher Timeframes: The indicator works exceptionally well on higher timeframes (4H, daily, weekly) where volume patterns are more significant
Range Trading: Use volume nodes to identify the boundaries of trading ranges
Combine with Price Action: Look for price action confirmation (rejections, engulfing patterns) at VPOC levels
Multiple Timeframe Analysis: Compare volume nodes across different timeframes to find confluent levels
Alert Setup: Set up alerts for when price enters important volume zones or crosses VPOC lines
Reversal Signals: High volume bars with significant wicks often signal exhaustion points where smart money is transferring positions. Bullish candles with long upper wicks suggest sellers absorbing buying pressure at highs, while bearish candles with long lower wicks indicate buyers stepping in at lows - both potentially signaling momentum shifts that precede reversals.
The indicator is particularly valuable for identifying levels where large players have been active in the market and are likely to defend or act again in the future.

3CRGANG - Histogram (Basic)This indicator provides traders with a unified view of momentum by combining multiple classic oscillators into a single histogram. By aggregating momentum signals into one visual output, it simplifies trend analysis, helping traders identify momentum shifts without managing multiple indicators separately.
What It Does
The 3CRGANG - Histogram (Basic) calculates a momentum-based histogram using a user-selected oscillator (e.g., RSI, MACD, MFI, RVI, Stochastic, Stochastic RSI, or TMASlope). The histogram is plotted with color-coded bars to indicate bullish, bearish, or neutral momentum, alongside predefined alert levels and a trend status table for quick reference.
Why It’s Useful
This script addresses the challenge of monitoring multiple momentum indicators by consolidating them into a single histogram. Each oscillator measures momentum differently (e.g., RSI tracks price strength, MACD focuses on moving average convergence, MFI incorporates volume), but the script normalizes these signals into a unified output. This reduces chart clutter and provides a clear, actionable signal for identifying trend direction, making it easier for traders to focus on key momentum shifts across various market conditions.
How It Works
The script follows these steps to generate the histogram:
Oscillator Selection: Traders choose one oscillator to base the histogram on. For example: RSI measures the speed and change of price movements, MACD tracks the relationship between two exponential moving averages, and MFI combines price and volume to measure buying/selling pressure. The choice of oscillator affects the histogram’s sensitivity to price movements.
Fast Oscillator Calculation: A fast-moving oscillator is computed using the selected method over a user-defined period (default: 8 bars). For instance, RSI calculates the relative strength of price gains versus losses, while MACD computes the difference between short and long EMAs. The result is normalized to a range centered around zero.
Histogram Plotting: The oscillator’s output is adjusted by a modification factor (default: 1) for sensitivity tuning and plotted as a histogram. Positive values indicate bullish momentum, negative values indicate bearish momentum, and values near zero suggest a lack of clear trend.
Color Coding: Bars are colored based on momentum and price direction: green for bullish momentum (price moving upward, histogram value typically positive), red for bearish momentum (price moving downward, histogram value typically negative), and grey for neutral momentum (ranging conditions or unclear trend).
Alert Levels: Predefined buy and sell levels are plotted as dotted lines to mark significant momentum thresholds. For most oscillators, levels are set at 20 (buy) and -20 (sell), representing overbought/oversold conditions based on historical performance. For TMASlope, levels are adjusted to 0.04 and -0.04, as it measures the slope of a triangular moving average relative to the average true range (ATR).
Trend Table: A table in the top-right corner displays the current timeframe’s trend status ("Buy Only," "Sell Only," or "Ranging") based on the histogram value, price direction, and alert levels, along with the histogram’s numerical value.
Underlying Concepts
The script is built on the concept of momentum aggregation, aiming to capture short-term price dynamics while filtering noise. By using a fast-moving oscillator, it emphasizes recent price action, and the histogram format provides a visual summary of momentum strength. The alert levels are derived from typical overbought/oversold thresholds for each oscillator, adjusted to ensure consistency across different methods. The trend table adds a layer of interpretation, helping traders quickly assess whether the momentum aligns with the broader trend.
Use Case
Trending Markets: In a bullish trend, green bars above the buy alert level (e.g., 20) indicate strong upward momentum, suggesting potential long entries. In a bearish trend, red bars below the sell alert level (e.g., -20) suggest short opportunities.
Ranging Markets: Grey bars or values between alert levels indicate a lack of clear momentum, prompting caution or scalping strategies.
Confirmation Tool: Use the histogram to confirm price action signals, such as breakouts or reversals, by ensuring momentum aligns with the direction of the move. For example, a breakout with green bars above the buy level may signal a stronger trend.
Settings
Choose Type: Select the oscillator to use (default: RSI - CLASSIC).
Source: Choose between Close or HL2 price data (default: Close).
Histogram Length: Set the period for oscillator calculation (options: 5, 8, 13; default: 8).
Modification Factor: Adjust the sensitivity of the histogram (default: 1).
Notes
The script supports classic oscillators only and operates on the current timeframe.
If volume data is unavailable for your ticker, MFI calculations may not work; select another oscillator to continue plotting.
Disclaimer
This indicator is a tool for analyzing market trends and does not guarantee trading success. Trading involves risk, and past performance is not indicative of future results. Always use proper risk management.

SUPeR TReND 2.718An evolved version of the classic Supertrend, SUPeR TReND 2.718 is built to deliver elegant, high-precision trend detection using Euler's constant (e = 2.718) as its default multiplier. Designed for clarity and visual flow, this indicator brings together smooth line work, intelligent color logic, and a minimalistic tally system that tracks trend persistence — all in a highly customizable, overlay-ready format.
Unlike traditional implementations, this version maintains line visibility regardless of fill opacity, ensuring crisp tracking even in complex environments. Ideal for traders who value both aesthetics and actionable structure.
__________________________________________________________
🔑 Key Features:
- 📐 ATR-based Supertrend with default multiplier = e (2.718)
- 📉 Dynamic trend line with optional fill beneath price
- ⏳ Trend duration tally label (count-only or full format)
- ⬆️ Higher-timeframe Supertrend overlay (optional)
- 🟢 Directional candle coloring for clarity
- 🟡 Subtle anchor line to guide perception without clutter
- ⚙️ PineScript v6 compliant, efficient and modular
__________________________________________________________
🧠 Interpretation Guide:
- The Supertrend line tracks trend support or resistance — beneath price in uptrends, above in downtrends.
- The shaded fill reflects direction with 70% transparency.
- The trend tally label counts how long the current trend has lasted.
- Candle colors confirm direction without overtaking price action.
- The optional HTF line shows higher-timeframe context.
- A soft yellow anchor line stabilizes the fill relationship without distraction.
__________________________________________________________
⚙️ Inputs & Controls:
- ✏️ ATR Length – Volatility lookback
- 🧮 Multiplier – Default = 2.718 (Euler's number)
- 🕰️ Higher Timeframe – Choose your bias frame
- 👁️ Show HTF / Main – Toggle each trend layer
- 🧾 Show Label / Simplify – Show trend duration, with or without arrows
- 🎨 Color Candles – Turn directional bar coloring on or off
- 🪄 Show Fill – Toggle the shaded visual rhythm
- 🎛️ All visuals use tuned colors and transparencies for clarity
__________________________________________________________
🚀 Best Practices:
- ✅ Works on any time frame; shines on 1h v. 1D
- 🔁 Use the HTF line for macro bias filtering
- 📊 Combine with volume or liquidity overlays for edge
- 🧱 Use as a structural base layer with minimalist stacks
__________________________________________________________
📈 Strategy Tips:
- 🧭 MTF Trend Alignment: Enable the HTF line to filter trades. If the HTF trend is up, only take longs on the lower frame, and vice versa.
- 🔁 Pullback Entries: During a strong trend, consider short-term dips below the Supertrend line as possible re-entry zones — only if HTF remains aligned.
- ⏳ Tally for Exhaustion: When the bar count exceeds 15+, look for confluence (volume divergence, key levels, reversal signals).
- ⚠️ HTF Flip + Extended Trend: When the HTF trend reverses while the main trend is extended, that may be a macro exit or fade signal.
- 🚫 Solo Mode: Disable HTF and use the main trend + tally as a standalone signal layer.
- 🧠 Swing Setup Friendly: Especially powerful on 1D or 1h in swing systems or trend-based grid strategies.
CandelaCharts - Fractal Range Model📝 Overview
The Fractal Range Model (FRM) is an all-encompassing and sophisticated trading framework that incorporates multiple market dynamics to provide a deeper understanding of price movements.
This model is built around several key principles, including Market Swing Points, Sweeps, Candle Mean, and Change in State of Delivery (CISD), which together offer a nuanced and effective approach to trading.
At its core, the model focuses on Market Swing Points, which represent crucial turning points in the market where price action shifts direction.
These points provide insight into potential reversals and momentum changes, allowing traders to identify key support and resistance areas.
Recognizing these swings is critical in anticipating future price movements and understanding the market’s underlying structure.
The Fractal Range Model (FRM) is a versatile trading strategy that adapts to various styles, whether you're into scalping, day trading, swing trading, or long-term investment. Its flexibility makes it suitable for traders with different time horizons and risk preferences, allowing it to be effectively applied across multiple market conditions.
📦 Features
Timeframe Alignment: This indicator reveals lower Timeframe movements within higher Timeframe candles, offering insights into micro trends, structure shifts, and key entry points.
Bias Selection: This feature lets analysts control bias and setup detection, viewing bullish, bearish, or neutral formations to align with higher Timeframe trends.
Double Purge Sweeps: A double purge is a type of Sweep where the price exceeds both the high and low of the previous candle (via wicks) and then closes within the range of the prior candle.
Time Filters: Sync Time and price by selecting custom Time windows to focus on relevant formations.
Higher Timeframe Candles: The Fractal Range Model integrates ICT Power of Three, helping traders spot key turning points and market transitions across Timeframes.
Higher Timeframe PD Arrays: The HTF PD Arrays (FVG, IFVG) are key points of interest that indicate significant market levels where valid sweeps are likely to occur.
Lower Timeframe PD Arrays: The LTF PD Arrays (FVG, IFVG), on the other hand, are used for identifying entry points.
Smart Money Technique: In the context of the Fractal Range Model (FRM), the SMT (Smart Money Technique) serves as a crucial confluence indicator that strengthens the reliability of a formed model.
Info Panel: Display a customizable table with key details like timeframe pairing, time to next candle close, bias, and time filter settings, with full control over size, location, and borders.
Suitable for any Market: Ideal for all markets - stocks, forex, crypto, futures, commodities and more - delivering consistent results and insights across diverse trading environments.
⚙️ Settings
Core
Status: Filter models based on status
Bias: Controls what model type will be displayed, bullish or bearish
Fractal: Controls the timeframe pairing will be used
Mean: Plots the equilibrium of the previous HTF candle
Liquidity: Displays the liquidity levels that belongs to the model
Sweep: Shows the sweep that forms a model
I-sweep: Controls the visibility of invalidated sweeps
D-purge: Plots the double purge sweeps
CISD: Displays the Change In State of Delivery for a model
Labels: Adjust the HTF candle label size
C-area: Highlights the region between current candle open and previous candle equilibrium
History
History: Controls the mount of past models displayed on the chart
Filters
Asia: Filter models based on Asia Killzone hours
London: Filter models based on London Killzone hours
NY AM: Filter models based on NY AM Killzone hours
NY Launch: Filter models based on NY Launch Killzone hours
NY PM: Filter models based on NY PM Killzone hours
Custom: Filter models based on user Custom hours
HTF
Candles: Controls the number of HTF candles that will be visible on the chart
Open: Highlights with a line the open price of current HTF candle
Show True Day Open: Display True Day Open line
Offset: Controls the distance of HTF from the current chart
Space: Controls the space between HTF candles
Size: Controls the size of HTF candles
PD Array: Displays ICT PD Arrays
CE Line: Style the equilibrium line of PD Array
Border: Style the border of PD Array
LTF
H/L Line: Displays on the LTF chart High and Low of each HTF candle
O/C Line: Displays on the LTF chart Open and Close of each HTF candle
PD Array: Displays ICT PD Arrays
CE Line: Style the equilibrium line of PD Array
Border: Style the border of PD Array
Projections
StDev: Controls standard deviation available levels
Labels: Controls the size of standard deviation levels
Anchor: Controls the anchor point of standard deviation levels (wick, body)
Lines: Controls the line widths and color of standard deviation levels
SMT
Show: Display SMT
Symbol: Symbol 1
Symbol: Symbol 2
Style: Controls the color of Bearish and Bullish SMTs
Dashboard
Panel: Display information about current model
💡 Framework
The model includes the following timeframe parings:
15s - 5m
1m - 15m
1m - 30m
2m - 20m
3m - 30m
3m - 60m
5m - 1H
15m - 4H
15m - 8H
30m - 9H
30m - 12H
1H - 1D
2H - 2D
3H - 3D
4H - 1W
8H - 2W
12H - 3W
1D - 1M
2D - 2M
1W - 3M
2W - 6M
3W - 9M
1M - 12M
The Fractal Range Model follows a specific lifecycle, which highlights the current state of the model and determines whether a trade opportunity is valid.
The model's lifecycle includes the following statuses:
Formation (grey)
Invalidation (red)
Success (green)
1. Formation
The Formation phase marks the initial setup of the Fractal Range Model. During this stage, the model identifies and plots key components, such as:
Sweeps: Market movements that indicate a potential reversal or strong shift in trend.
CISD (Change In State of Delivery): A structural change that provides insight into trend shifts.
Once these components are detected, the model automatically calculates and displays Projections and Liquidity Levels , offering insights into potential price action movements.
At this stage, the model also identifies and displays the following key elements:
HTF PD Arrays (Higher-Timeframe Price Delivery Arrays)
LTF PD Arrays (Lower-Timeframe Price Delivery Arrays)
Smart Money Technique (SMT)
If any of these elements are present, they will be automatically displayed on the chart.
2. Invalidation
A Fractal Range Model is considered invalidated when the price does not reach the 2 Standard Deviation level or the first identified liquidity level, and when the price breaks above the high that formed the Sweep.
Invalidation signals that the original setup is no longer reliable, and traders should avoid taking action based on the model's original parameters.
Key invalidation conditions:
Price fails to reach the 2 Standard Deviation level.
Price fails to reach the first liquidity level.
Price breaks the high/low that initiated the Sweep.
A potentially invalidated model is marked with a purple color above the label, indicating the sweep is invalidated by the next candle, but not the high that formed the sweep.
3. Success
A Fractal Range Model is considered successful when the price reaches the 2 Standard Deviation level or the first identified liquidity level. This indicates that the model's predictions align with actual market movements, confirming the setup's validity and providing a potential trading signal.
At this stage, alongside Projections and Liquidity levels, you'll also notice the C-area — the region between the current candle's open and the previous candle's mean. If respected, price action will follow the model's direction.
Key success conditions:
Price reaches the 2 Standard Deviation level.
Price reaches the first liquidity level.
By leveraging these phases, Formation, Invalidation, and Success, traders can effectively manage their positions, minimize risk, and capitalize on high-probability setups based on the Fractal Range Model.
⚡️ Showcase
Introducing Fractal Range Model is a powerful trading tool designed to elevate your market analysis and boost your trading success. Built with precision and advanced algorithms, this indicator helps you identify key trends, potential entry and exit points, and optimize your strategy for better decision-making.
History
HTF Candles
HTF PD Arrays
LTF PD Arrays
SMT
Unlock your full trading potential and experience the difference with Fractal Range Model — your ultimate tool for smarter, more informed trading decisions.
🚨 Alerts
This script offers alert options for all model types. The alerts need to be setup manually from Tradingview.
Bearish Model
A bearish model alert is triggered when a model forms, signaling a high sweep and CISD.
Bullish Model
A bullish model alert is triggered when a model forms, signaling a low sweep and CISD.
⚠️ Disclaimer
These tools are exclusively available on the TradingView platform.
Our charting tools are intended solely for informational and educational purposes and should not be regarded as financial, investment, or trading advice. They are not designed to predict market movements or offer specific recommendations. Users should be aware that past performance is not indicative of future results and should not rely on these tools for financial decisions. By using these charting tools, the purchaser agrees that the seller and creator hold no responsibility for any decisions made based on information provided by the tools. The purchaser assumes full responsibility and liability for any actions taken and their consequences, including potential financial losses or investment outcomes that may result from the use of these products.
By purchasing, the customer acknowledges and accepts that neither the seller nor the creator is liable for any undesired outcomes stemming from the development, sale, or use of these products. Additionally, the purchaser agrees to indemnify the seller from any liability. If invited through the Friends and Family Program, the purchaser understands that any provided discount code applies only to the initial purchase of Candela's subscription. The purchaser is responsible for canceling or requesting cancellation of their subscription if they choose not to continue at the full retail price. In the event the purchaser no longer wishes to use the products, they must unsubscribe from the membership service, if applicable.
We do not offer reimbursements, refunds, or chargebacks. Once these Terms are accepted at the time of purchase, no reimbursements, refunds, or chargebacks will be issued under any circumstances.
By continuing to use these charting tools, the user confirms their understanding and acceptance of these Terms as outlined in this disclaimer.

Cryptoin Awesome Indicator - Market StructureCryptoin Awesome Indicator - Market Structure (CAI-MS) 🌟
The Cryptoin Awesome Indicator - Market Structure (CAI-MS) is an advanced, proprietary overlay tool designed to decode market structure and price action dynamics with precision. Unlike traditional indicators that rely on lagging oscillators or moving averages, CAI-MS focuses on real-time swing point analysis and structural breakouts, offering traders a clear, actionable framework for identifying trend shifts, continuations, and key decision zones in forex, stocks, or crypto markets. 📊
What It Does: 📝
CAI-MS maps the market’s structural evolution by detecting and classifying swing points—Higher Highs (HH), Lower Highs (LH), Higher Lows (HL), and Lower Lows (LL)—based on a customizable lookback period. It then tracks price interactions with these levels to signal two critical events:
✅ Break of Structure (BOS): When price breaches a prior swing high or low, indicating potential trend continuation. 🚀
✅ Change of Character (CHoCH): When price invalidates the most recent swing in the opposite direction, suggesting a possible reversal. 🔄
Additionally, it plots fixed-length liquidity zones (BSL/SSL) derived from unbroken swing levels, helping traders anticipate support/resistance or stop-loss hunting areas. 🛡️
How It Works: ⚙️
The indicator uses a unique swing detection algorithm that analyzes price extremes over a user-defined number of bars (Swing Length). This avoids the noise of smaller fluctuations and focuses on significant pivots. Once a swing point is confirmed:
✅ It labels the pivot (e.g., HH, LH) to reflect the current structure. 🏷️
✅ If price breaks a prior high or low, a BOS line is drawn to mark the breakout, visually connecting the breached level to the breakout candle. 📏
✅ If the breakout reverses the prior trend (e.g., breaking a LH in a downtrend), it flags a CHoCH, alerting traders to a potential shift. ⚠️
✅ Unbroken swing levels extend as BSL/SSL lines for a fixed duration, offering strategic reference points. 🎯
This methodology combines structural analysis with breakout confirmation, distilled into a clean, overlay format that doesn’t clutter charts with redundant data.
Key Features: ✨
✅ Swing Point Detection: Identifies and labels HH, LH, HL, and LL with adjustable sensitivity, ensuring relevance across timeframes. 🔍
✅ BOS & CHoCH Visualization: Plots breakout lines and labels to highlight trend momentum or reversal setups. 📈
✅ Liquidity Zones (BSL/SSL): Extends prior swing levels as potential support/resistance, with customizable length and style. 🧱
✅ Customization: Toggle labels on/off, adjust line colors, styles (solid, dashed, dotted), and thickness to match your workflow. 🎨
✅ Original Approach: Unlike public tools relying on MAs or RSI, CAI-MS uses a proprietary pivot-based system tailored for structure traders. 🦄
Why It’s Valuable: 💎
This isn’t a mashup of classic indicators—it’s a purpose-built solution for market structure enthusiasts. Public scripts often flood charts with generic signals; CAI-MS delivers focused, context-aware insights by synthesizing swing analysis, breakout detection, and liquidity projection into one cohesive tool. Its closed-source design protects a unique algorithm that adapts to price action without overfitting or repackaging common techniques.
How to Use It: 🛠️
✅ Trend Continuation: Enter long after a BOS above a prior HH, or short below a prior LL, using BSL/SSL as take-profit zones. 📈
✅ Reversal Trades: Watch for CHoCH signals (e.g., price breaking a LH in a downtrend) to anticipate shifts, with BSL/SSL as stop-loss guides. 🔄
✅ Scalping/Swing Trading: Adjust Swing Length (e.g., 10 for scalping, 50 for swings) to match your timeframe. ⏱️
Pair it with a clean chart (no other indicators needed) to maximize clarity—add drawings like trendlines if desired, but the indicator stands alone.
Customization Options: 🖌️
✅ Swing Length: Increase (e.g., 50) for fewer, stronger pivots; decrease (e.g., 10) for more frequent signals. ⚖️
✅ Visuals: Enable/disable swing labels, tweak BOS line styles, or adjust BSL/SSL length (default: 50 bars). 🎚️
